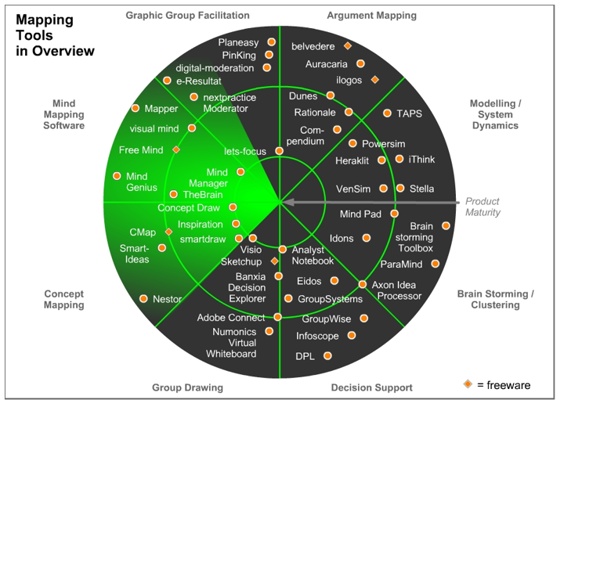
Let's focus Export - Mapping Tools Radar visual literacy.pos
Scribblar - Free Interactive Online Whiteboard
How to Get Free E-books
E-books have been around for a very long time, though modern E Ink devices like the Kindle and Nook have brought this electronic literature to more than just a few geeks with PDAs. I remember reading e-books on a Handspring Visor, perhaps one of the closest things to an iPod touch back in the early 2000s. E-books have enabled people access to a library without the bulk of the actual books. Binding and paper can be very heavy, especially in mass. Today, I can hold pretty much my entire library in a device that fits in the smallest pocket of my laptop bag. So how do you get books for free? Scribd Scribd is one of those sites that makes documents of any and every type available to to the public. Books are available in a variety of ways. OBOOKO (standing for Online Book Offline) is an English site dedicated to allowing new and established authors to self-publish and promote their books, free of charge. The NTSlibrary Enter the NTSlibrary, a leading online Christian study resource center.
How to use Calibre to access your ebook collection online
Calibre is one of the most powerful ebook managers available. But did you know that Calibre has a built in server that allows you to access your library from a web browser? In this how-to, Jack Wallen shows you how to set up Calibre to serve up your book library. I have been in near-saturation mode with ebooks lately, due to the publishing of my own works of fiction (find them on Amazon, Barnes & Noble, and Smashwords). Naturally Linux is not left out of this mix. Features Calibre offers the following features: Library ManagementE-book conversionSyncing to e-book reader devicesDownloading news from the web and converting it into e-book formComprehensive e-book viewerContent server for online access to your book collectionCross platform (Available for Linux, Windows, and Mac) As you can see, Calibre will be a much more usable tool than what your ereader came with. Open up Calibre and then go into the preferences window. The future of books
3 Ways Mind Mapping Can Be Used to Enhance Learning
The following is brought to you by MindMaple , creator of mind mapping software. To provide some inspiration for MindMaple’s mapping contest , here are some creative ways mind mapping can be used for education to enhance learning. Mind mapping is probably best known as a tool for business organization and planning. However, mind mapping can also be an excellent tool for education, especially if you’re willing to get creative. 1. Spatial organization is a helpful tool, but sometimes a single dimension of grouping is not sufficient to show all the relevant information. The better mind mapping tools offer topic customization features offer users a variety of ways to personalize map design, allowing you to choose from a variety of preset colors, or design your own. 2. Some ideas are much easier to communicate using visuals instead of text only. The water cycle illustrates the many roles of H20 in the environment, and can be conveyed much more effectively with a chart than with text. 3.
Lectures from the World's Top Scientists
Posted on Thursday June 18, 2009 by Staff Writers By Sarah Russel Unless you’re enrolled at one of the best online colleges or are an elite member of the science and engineering inner circle, you’re probably left out of most of the exciting research explored by the world’s greatest scientists. If you’re looking for even more amazing lectures, check out our updated list for 2012 with more talks from great minds. General Let the world’s top scientists explain exactly how they do their job when you listen to these lectures. Science and Engineering From materials science to the study of thermodynamics, learn more about the science of engineering here. WTC Lecture – collapse of WTC Buildings: Steven E. Biology and Medicine From drug research to evolution to writing the genetic code, watch these lectures for the latest developments in biology and medical research. Chemistry These chemistry scientists discuss the atomic theory of matter and other mind-boggling principles in the following lectures.
In Libro Veritas - La passion de lire et ecrire
100 Reasons to Mind Map
100 examples of how you can use mindmapping whether completely new to mind maps or a seasoned pro. I hope the list helps generate ideas for you. 100 Reasons to Mind Map 1. Explore a subject 2. Study & learn a new topic, culture or country 3. Want to share your Mind Maps with others? Here are the 100 reasons on one page:
Encyclopedia of Earth
Physics
Related:
Related:
