
EDge21 Mais - Recursos educacionais multimídia De Mais - Recursos educacionais multimídia Este repositório reúne de maneira organizada vários recursos educacionais (objetos de aprendizagem) multimídia disponíveis gratuitamente na internet para uso do professor e do estudante de Matemática. São mais de 150 recursos educacionais entre áudios, vídeos, softwares, textos e experimentos práticos. Últimos recursos adicionados: o vídeo The last banana e o livro Frações no Ensino Fundamental - Volume 1. Listas especiais Kturtle: diversos códigos prontos e materiais adicionais para quem deseja aprender a programar nesse ambiente de introdução à programação similar ao Logo Matmidias: lista com os objetos de aprendizagem utilizados nos cursos da série M@tmídias da SEcretaria de Educação do Estado de São Paulo Geogebra: alguns tutorias sobre o software Geogebra Origem e autoria Salientamos que a Mais não é autora da maior parte dos recursos educacionais aqui disponíveis, porém, todos estão sob licenças que permitem o uso e distribuição.
SMART Notebook Math Tools for Education Add-on to SMART Notebook software With SMART Notebook Math Tools you receive a variety of math-specific tools, as well as access to all the great features and Gallery items available in SMART Notebook software. SMART Notebook Math Tools embeds all the tools you need right into SMART Notebook software, saving you from running several different applications during a lesson. Customizable math toolbar Get instant access to math-specific tools within SMART Notebook software. Handwriting recognition and equation solving Handwrite questions on the fly - SMART Notebook Math Tools recognizes handwritten mathematical equations and symbols that can be solved and graphed. Advanced equation editor Insert and edit textbook-quality equations into your lesson activities with the advanced equation editor. Texas Instruments emulator integration If you have a Texas Instruments emulator, you can launch it with one click in SMART Notebook Math Tools. Table and graphing tools Graph Wizard New and improved shapes
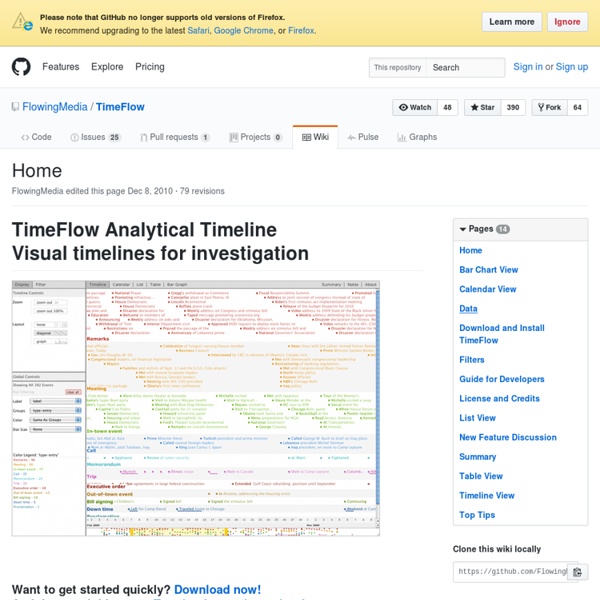
Mathway | Math Problem Solver GED Viz, A Data Storytelling Tool | eagereyes I had the honor and pleasure to keynote an event in Berlin recently that introduced a new visualization tool to the world, GED Viz. What makes it stand out from other web-based visualization tools is its focus on particular data, and the ability to create not just individual views, but little stories. GED stands for Global Economic Dynamics, which explains where the motivation for the project actually came from: the need to show the underlying data when explaining global relationships based on the movement of goods, money, and people between countries. The visualization is essentially a chord diagram, showing the countries around a circle and connecting them with bands through the center. What interests me about the project more than the basic visualization is the ability to create little slideshows, or stories. When you open that slideshow in edit mode (by clicking in the lower right), you can create new slides and delete or rearrange existing ones.
o usar o YouTube para estudar para o vestibular Física pode ficar mais fácil se você usar os vídeos na internet a seu favor Uma pesquisa realizada pela Norton Online Living no começo deste ano apontou que os jovens brasileiros gastam, em média, 70 horas por mês na internet. Desse período, 13 horas são dedicadas a redes sociais e de compartilhamento de vídeos, como o Youtube. Disponível em 19 regiões do mundo e 14 idiomas, o maior portal de vídeos da internet se expande continuamente: a cada minuto, são incorporadas mais de 20 horas de imagens. O GUIA DO ESTUDANTE selecionou canais do Youtube que podem ajudar os alunos do Ensino Médio e vestibulandos em geral em provas e processos seletivos. MATEMÁTICACanal Só Matemática: Vídeo-aulas separadas por assunto. HISTÓRIACanal História e Ciência: Documentários que mostram a interseção entre história e biologia, tratando temas que vão de pandemias a múmias e evolucionismo. GEOGRAFIACanal Só Geografia: Os cenários não são lá muito bonitos, mas o que importa são as aulas, divididas por temas.
E se a Segunda Guerra mundial tivesse sido registrada no facebook? Essa semana a internet brasileira foi bombardeada por uma tradução de um post publicado no 9gag. Muita gente já viu rolando por aí. Épico seria uma boa definição. A Guerra quase como uma conversa bem humorada de um Grupo de Amigos e Rivais no facebook, mostrando pro mundo todo que não são só eventos cotidianos que mostram o que a galera está fazendo. Mas, o que se apresenta aqui são as discussões entre os Estados, gírias, situações um pouco cômicas e que mostram o lado político da Guerra de uma forma diferente, chegando até a bastante cômico. Confira: Gostou deste post?
Label 59 : Label . Explain . Present interactively ... in minutes | Create Stunning Product Feature Demos in FLASH & HTML5 | Highlight Product Key Features | Label Diagrams | Interactive Presentations | Engaging Learning Material analise1discurso1online [licensed for non-commercial use only] / 6 Software Considerando o grande volume de dados com que a investigação qualitativa tem de lidar e o facto das técnicas a que recorre exigir o manuseamento de grande quantidade de documentos em texto, decorrentes de anotações das observações de campo, de transcrições de entrevistas e de grupos de discussões, bem como literatura vária e páginas web, foram surgindo ferramentas informáticas para ajudar a fazer a codificação e categorização dos conteúdos. Da pesquisa realizada foi encontrado um diretório de ferramentas - - que reune um número considerável de programas de análise de dados, destacando-se alguns deles: a) MAXQDA ( O MAXQDA é um software de análise qualitativa de dados que permite avaliar sistematicamente dados qualitativos e interpretar dados textuais através da análise de conteúdos. b) NVivo ( c) ATLAS.ti (
ATEP Make a Contour Map 1. Show students map images and introduce the activity.Display the images of topographic, or contour, maps. Make sure students understand that contour maps, though 2-dimensional, use contour lines to show elevation above sea level. Point out the flattest and steepest areas on the Crater Lake map. Ask students to describe how the map uses contour lines to show which terrain is steep and which is flat. Then tell students that they are going to make their own contour maps with DOGSTAILS. 2. 3. Have pairs shape their clay into a mountain on the drawing paper and mark its peak with a dot. 4. 5. 6. Date: when the map was madeOrientation: direction (north arrow or compass rose)Grid: lines that cross to form squaresScale: map distanceTitle: what, where, and whenAuthor: who made the mapIndex: the part of the grid where specific information can be locatedLegend: what the symbols meanSources: who provided information for the map 7. As a class, revisit the contour map images.