
40+ Tools to Create Infographics with Your Students. Here is a comprehensive list of some very good tools for making infographics.

The list features more than 40 applications so you have a wide variety of options to choose from.While some of these tools are pretty basic and you can use them without any complications, others do require some advanced tech knowledge and design know-how. As a teacher and educator, my favourite infographic making tools are Google Draw and Pictochart. I invite you to read this step by step visual guide to learn more about how you can easily set up your infographic using Google Draw.
Also bear in mind that most of these tools require a sign-up and some of them are fremium: they have, besides the basic free version, a pro version that offers more advanced features. I ll let you now explore this list and looking forward to your feedback. The Noun Project. Infographics Tools & Apps. Great Infographic Making Tools for Teachers.
1- Visual.ly This is my favorite tool.

It helps you easily create awesome infographics using pre-designed templates. It also lets you create an infographic out of any Twitter Hashtag provided you are signed in which you can do using your Twitter account. 30+ Really Useful Infographics Tools & Resources. Infographic credit: Ivan Cash Infographics are everywhere! Whether you’re a fan of them or not , infographics have become a staple of web content and are engaged in a seemingly endless love affair with social media. As digital marketers, we’re interested in the content marketing potential of infographics, which can generate thousands of pageviews, social media shares, backlinks and capture mindshare. If you’re interested in developing your own infographics to reap these potential benefits, we put together this list of 30+ useful infographic tools and resources to help you on your way.
We included a well-rounded mix of charts & graphs generators, graphics programs, mind-mapping tools, and resources for finding data sets and statistics. Whether you’re just looking for simple online charting tools or seeking complex data visualization software, the list below has got you covered! (Listed below in Alphabetical order!) Comments(12) Image Map Tool - On-line Image Map Creator - HTML & CSS. 9 Data Visualization Tools for Librarians and Educators.
Data visualization and infographics tools are a great way to keep students and readers engaged.
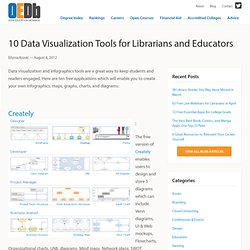
Here are ten free applications which will enable you to create your own infographics, maps, graphs, charts, and diagrams: Creately The free version of Creately enables users to design and store 5 diagrams which can include Venn diagrams, UI & Web mockups, Flowcharts, Organizational charts, UML diagrams, Mind maps, Network plans, SWOT analysis, Value stream maps, TQM diagrams and more.
Stat Planet Used by the UN, NASA, and many Fortune 500 companies, Stat Planet will let you create customizable, interactive maps or graphs with data you import. Gunn Map 2 Gunn Map 2 is a completely online application which also lets you create customizable maps with your own data. Many Eyes Gliffy Wordle - Create beautiful and fully customizable word clouds with this free tool.
Instantly create a word cloud for your blog or website by entering the RSS feed! Piktochart- Infographic & Presentation Tool. How to Get Started With Infographics. Media and publishing professionals know that infographics are hugely popular, and are more likely to be shared via social media than a standard blog post or article.

By combining images with data, infographics get much more mileage than text or graphics alone. You can use them for news, presentations, or press releases on your company blog or website to attract publicity and show off your expertise. Companies without a graphic designer on board or on budget couldn't easily take advantage of infographics in the past. However, thanks to online chart and map creation tools, any business can now turn an interesting concept into an engaging infographic.
Here's how to get started, along with tools that can step you through the process. Choose Your Graphics and Data Wisely Every business holds expertise in something, and that specialized knowledge can make for an interesting piece. Data from Google. Free infographic app. Piktochart- Infographic & Presentation Tool. Eight Free tools for Teachers to Make Awesome Infographics.
1- Easel.ly This is a great tool that allows users to create visually rich infographics from pre-designed themes.

It is very easy to use and only drag and drop. It actually supports Chrome, Firefox, and Safari. 2- Stat Planet This one here allows users to create amazing visualisations and share them with others. It can be used either within your browser or download the software for free. 3- Hohli This is an awesome chart maker. 4- Creately This is also a great tool in creating diagrams and flow charts. 5- Many Eyes This is one of the easiest of them all. 6- Wordle This is a text based visualisation tool. 7- Tableau This works just on Windows. 8- Inkspace This is also a free infographic creation tool. Education Infographics. MAKE YOUR OWN INFOGRAPHIC.