
Qrcode.js. QRCode.js is javascript library for making QRCode.
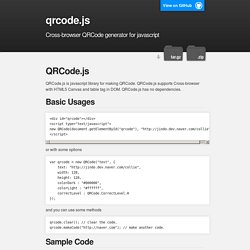
QRCode.js supports Cross-browser with HTML5 Canvas and table tag in DOM. QRCode.js has no dependencies. Basic Usages <div id="qrcode"></div><script type="text/javascript"> new QRCode(document.getElementById("qrcode"), " </script> or with some options and you can use some methods. Gauge.js. Example Variant selection Features No images, no external CSS - pure canvas No dependencies (jQuery is supported, but not required) Highly configurable Resolution independent Animated guage value changes (!)

Works in all major browsers MIT License Usage The Gauge class handles drawing on canvas and starts the animation. Advanced options jQuery plugin Gauge.js does not require jQuery. . $.fn.gauge = function(opts) { this.each(function() { var $this = $(this), data = $this.data(); if (data.gauge) { data.gauge.stop(); delete data.gauge; } if (opts ! Supported browsers. Turn.js: The page flip effect in HTML5. Babylon.js. Getting started. Bootstrap is downloadable in two forms, within which you'll find the following directories and files, logically grouping common resources and providing both compiled and minified variations. jQuery required Please note that all JavaScript plugins require jQuery to be included, as shown in the starter template.
Consult our bower.json to see which versions of jQuery are supported. Precompiled Bootstrap Once downloaded, unzip the compressed folder to see the structure of (the compiled) Bootstrap. Copy bootstrap/ ├── css/ │ ├── bootstrap.css │ ├── bootstrap.css.map │ ├── bootstrap.min.css │ ├── bootstrap.min.css.map │ ├── bootstrap-theme.css │ ├── bootstrap-theme.css.map │ ├── bootstrap-theme.min.css │ └── bootstrap-theme.min.css.map ├── js/ │ ├── bootstrap.js │ └── bootstrap.min.js └── fonts/ ├── glyphicons-halflings-regular.eot ├── glyphicons-halflings-regular.svg ├── glyphicons-halflings-regular.ttf ├── glyphicons-halflings-regular.woff └── glyphicons-halflings-regular.woff2 Installing Grunt. Open source HTML5 Charts for your website. Three.js - JavaScript 3D library.
MooTools - a compact javascript framework. Mootools en 30 jours : jour 1 - Introduction. Installation de Mootools 1.2 Tout d'abord, téléchargez et installez le noyau (core) de la librairie Mootools 1.2.

Téléchargez la librairie Mootools 1.2 CoreUploadez la librairie de Mootools 1.2 sur votre serveur ou espace de travailFaites un lien vers la librairie Mootools 1.2 Core entre les balises de votre page - 2. Créer un fichier JavaScript externe et faire le lien vers celui-ci dans votre : A partir de là, vous pouvez utiliser l'une ou l'autre des méthodes. Placer dans le domready Les fonctions Mootools doivent être appelées dans l'évènement domready. window.addEvent('domready', function() { exampleFunction();}); Placer dans une Fonction Vous pouvez quand même placer vos fonctions en dehors du domready, puis les appeler à l'intérieur de celui-ci. var exampleFunction = function() { alert('hello')}; Description de la librairie Noyau Natif Classes Une classe JavaScript (c'est différent d'une classe CSS), est un objet réutilisable avec des fonctionnalités.
Elements Utilitaires. Zepto Docs. JavaScript InfoVis Toolkit. Enchant.js - A simple JavaScript framework for creating games and apps. Unbeatable JavaScript Tools. Raphaël—JavaScript Library. gRaphaël—Charting JavaScript Library. jQuery - The Write Less, Do More, JavaScript Library. Backbone.js. Easy Ajax and DOM manipulation f. Script.aculo.us - web 2.0 javascript.
CanvasGraph.js : Graphing in Javascript. Unmaintained CanvasGraph is now replaced by PlotKit which offers the same functionality as CanvasGraph but also includes SVG support and preliminary event support.

CanvasGraph will not be updated any more. There is now a PlotKit mailing list for thos who are interested in using or further development with graphing in Javascript. - Alastair Tse (21st March 2006) Introduction Canvas Graph is a small simple javascript library that allows you to conveniently plot simple line, bar and pie charts using the new HTML Canvas Tag. The motivation for this work is to allow simple graph plotting in Javascript without resorting to anything but your web browser. Don't know what the Canvas HTML Tag is? Pages that Use CanvasGraph Requirements Note: This does not work on Internet Explorer. Features Plot bar charts, line graphs and pie charts Plot multiple datasets on one graph.