
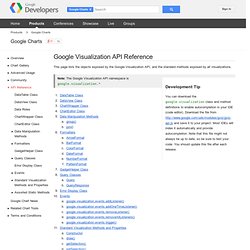
Visualization API Reference - Google Chart Tools - Google Code. This page lists the objects exposed by the Google Visualization API, and the standard methods exposed by all visualizations.

Development Tip You can download the google.visualization class and method definitions to enable autocompletion in your IDE (code editor). Download the file from and save it to your project. Most IDEs will index it automatically and provide autocompletion. Note that this file might not always be up to date, so be sure to test your code. Note: The Google Visualization API namespace is google.visualization A Note on Arrays Some browsers don't properly handle trailing commas in JavaScript arrays, so don't use them.
Data = ['a','b','c', ,]; // BAD data = ['a','b','c']; // OK data = ['a','b', ,'d']; // Also OK. Google.visualization.DataTable Class Represents a two-dimensional, mutable table of values. Each column is assigned a data type, plus several optional properties including an ID, label, and pattern string. See also: QueryResponse.getDataTable Constructor Syntax Details. Creating and Using Chart Gadgets - Google Chart Tools - Google Code. This document describes how to create a chart gadget.
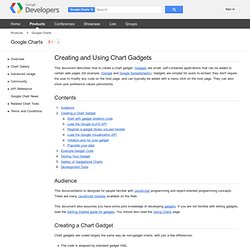
Gadgets are small, self-contained applications that can be added to certain web pages (for example, iGoogle and Google Spreadsheets). Gadgets are simpler for users to embed: they don't require the user to modify any code on the host page, and can typically be added with a menu click on the host page. They can also store user preference values persistently. Contents Audience This documentation is designed for people familiar with JavaScript programming and object-oriented programming concepts. This document also assumes you have some prior knowledge of developing gadgets. Creating a Chart Gadget Chart gadgets are coded largely the same way as non-gadget charts, with just a few differences: The code is wrapped by standard gadget XML. Here are the basic steps for creating a chart gadget: Start with gadget skeleton code. Here is code for a chart gadget.
<Content type="html"><! <script> var gadgetHelper = null; var table = null; ]]> </Content> Google Visualization API (From Spreadsheet) Visualization API Reference. This page lists the objects exposed by the Google Visualization API, and the standard methods exposed by all visualizations.

Development Tip You can download the google.visualization class and method definitions to enable autocompletion in your IDE (code editor). Download the file from and save it to your project. Most IDEs will index it automatically and provide autocompletion. Note that this file might not always be up to date, so be sure to test your code.
Note: The Google Visualization API namespace is google.visualization A Note on Arrays Some browsers don't properly handle trailing commas in JavaScript arrays, so don't use them. Data = ['a','b','c', ,]; // BAD data = ['a','b','c']; // OK data = ['a','b', ,'d']; // Also OK. Visualization API Reference - Google Chart Tools - Google Code. This page lists the objects exposed by the Google Visualization API, and the standard methods exposed by all visualizations.

Development Tip You can download the google.visualization class and method definitions to enable autocompletion in your IDE (code editor). Download the file from and save it to your project. Most IDEs will index it automatically and provide autocompletion. Note that this file might not always be up to date, so be sure to test your code. How to use Google Visualization API - Data-gov Wiki. From Data-gov Wiki Audience This tutorial assumes that the reader is familiar with RDF, Javascript (+HTML), SPARQL, and some XSLT. Using Google Visualization API Google Visualization API [1] establishes two conventions: a common interface to expose data on the web. Because the Google Visualization API provides a platform that can be used to create, share and reuse visualizations written by the developer community at large, you can create reports and dashboards as well as analyze and display your data through the wealth of available visualization applications.
Describes the distinction between image charts and interactive charts. Data formats that Google Visualization accepts All Google visualization constructs accept an instance of the Javascript object google.visualization.DataTable, which can be instantiated in one of two ways. Direct construction of a DataTable within Javascript In the case above, a data table is constructed and stored in variable data. Construct SPARQL query For example: Visualization API Reference - Google Chart Tools - Google Code.
This page lists the objects exposed by the Google Visualization API, and the standard methods exposed by all visualizations.
Development Tip You can download the google.visualization class and method definitions to enable autocompletion in your IDE (code editor). Download the file from and save it to your project. Most IDEs will index it automatically and provide autocompletion. Note that this file might not always be up to date, so be sure to test your code.