
Eloquent JavaScript. Turn a Windows 8.1 PC Into a Wi-Fi Hotspot with the Command Prompt. Web users judge sites in the blink of an eye. Stephen Few on Data Visualization. Day 2 of Tableau's Customer Conference kicked off with a fantastic talk on data visualization by Stephen Few: "Perceptual Zen: Learning to Meaningfully See".
Riffing off Garr Reynold's Zen theme from Garr's upcoming Presentation Zen talk, Stephen presented his 8 core ideals for effective data visualization tools. Stephen says that data visualization is just a tool. We could build houses before we had hammers and saws, the tools just let us do it better. That is, assuming we've developed the skills to use the tool effectively. How To Visualize Your Facebook Friend Network · AllThingsGraphed.com. 28 Aug 2014 There are apps that will generate certain types of network visualizations of your Facebook data.
However, this guide is aimed at those who would like to dig deeper into their own data and have more control into how it is visualized. Often visualizing and analyzing graphs and networks requires a certain amount of effort to familiarize yourself with the data to gain intuition on how the data is related. Datawrapper. Full-Featured Software Design Tool with UML and BPMN. 20+ Of The Most Creative Tea Infusers For Tea Lovers. What's the fun in using a plain old boring tea infuser?

If you're a fan of tea, you'll love these creative tea infusers! Statistically speaking, you probably are a tea drinker since tea is the most popular drink in the world (yes, even more than coffee). Most people use tea bags if they want to drink some tea on the run, but if you really want to enjoy the good stuff, then it's loose leaf or nothing. CreatingCTA Final (4) The Ultimate Guide to Golden Ratio Typography. Right now, there’s a mathematical symphony happening on your website. Every single one of your readers is subconsciously aware of this symphony, and more important, they are all pre-programmed to respond to it in a particular way. How to Become a Data Visualization Freelancer. I kept my promise: the interview with Moritz Stefaner on data visualization freelancing is finally here!
And I am really excited. As I said in my introductory post, I think data visualization freelancing is one of the most exciting trends in visualization; even though it’s a little bit hidden. After recording the interview, I must say I am really satisfied. I learned something out of it and I am sure the same will be totally true for you. The video is a bit long (see the content breakdown below) but it’s really worth it: we covered a very large number of questions and they all came directly from the readers (thanks to all of you guys)!
Any comment, question, or suggestion for me and Moritz is more than welcome. Long Tail CTR Study: The Forgotten Traffic Beyond Top 10 Rankings. Search behavior is fundamentally changing, as users become more savvy and increasingly familiar with search technology.
Google’s results have also changed significantly over the last decade, going from a simple page of 10 blue links to a much richer layout, including videos, images, shopping ads and the innovative Knowledge Graph. We also know there are an increasing amount of touchpoints in a customer journey involving different channels and devices. Google’s Zero Moment of Truth theory (ZMOT), which describes a revolution in the way consumers search for information online, supports this idea and predicts that we can expect the number of times natural search is involved on the path to a conversion to get higher and higher. Pavel Trejbal. LinkedIn. LinkedIn. Sleep Deprivation Is Killing You and Your Career. How to Become a Data Visualization Freelancer. The Data Visualization Beginner’s Toolkit #2: Visualization Tools. (Note: if you are new to this series, the DVBTK doesn’t teach you how to do visualization.
Rather it is meant to help people find a less chaotic and more effective path towards the acquisition of the necessary skills to become a data visualization pro. To know more, make sure to read the introduction to the series first.) The DVBTK #1 introduced books and study material to make sure you acquire the right knowledge in the right order. Studying is the first step and there’s no level of practice that can substitute for it.
Www.perceptualedge.com/articles/b-eye/data_visualization_bookshelf.pdf. The Data Visualization Beginner’s Toolkit #1: Books and Other Resources. One of the main goals of this blog, other than challenging the status quo with reflections at the intersection between academics and practitioners, is to help people become data visualization experts.
It’s not rare for me to receive emails from people who are enthusuastic about visualization but have little guidance about how to become an expert. I have been posting some few articles in the past with this specific goal but I realized that they are too scattered and not organized in a way to represent an organic resource for the readers. Wp-content/uploads/2013/10/handout.pdf. Excel Elbow Grease: How to Fool Excel into Making (Pretty Much) Any C… #14ntcdataviz: DataViz! Tips, Tools, and How-tos for Visualizing Your… Helpful Tips #10: Visualise your website content network with Gephi. Sitemaps are so 2003 (nah, they’re OK really).
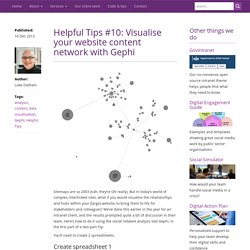
But in today’s world of complex, interlinked sites, what if you would visualise the relationships and hubs within your (large) website, to bring them to life for stakeholders and colleagues? We’ve done this earlier in the year for an intranet client, and the results prompted quite a bit of discussion in their team. Here’s how to do it using the social network analysis tool Gephi, in the first part of a two-part Tip: You’ll need to create 2 spreadsheets. Create spreadsheet 1 The first spreadsheet will be for your HTML pages and you can save this as nodes.csv All you need is 2 columns: Column A, labelled ID, is a unique number used to reference each HTML page Column B, labelled LABEL, will be the title of your HTML page You can use extra columns to import additional information for each page such as categories, levels or tags.
» Visualize the link structure of your website using free tools vpascual.org. There is a big value in understanding the hyperlink structure of our website as I pointed out in my PhD thesis.
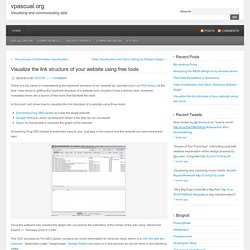
At the time I was doing it, getting the hyperlink structure of a website and visualize it was a tedious task. However, nowadays there are a bunch of free tools that facilitate this task. In this post I will show how to visualize the link structure of a website using three tools: Screaming Frog SEO Spider to crawl the target websiteGoogle Refine to clean up data and obtain a file that can be visualizedGephi: to manipulate a visualize the graph of the website Screaming Frog SEO Spider is extremely easy to use. Once the software has crawled the target site, proceed to the extraction of the inlinks of the site using “Advanced Export” -> “Success (2xx) in Links”. The CSV provided by Fro SEO Spider contains too much information for what we need, which is a CSV file with two columns: “destination page”;”target page”. Using Gephi with Google Analytics to visualize keywords and landing pages.
As of late, I've been playing a lot with data analysis and visualization tools.
Recently I've read two interesting books (Statistical Analysis with R and Visualize This: The FlowingData Guide to Design, Visualization, and Statistics. Gephi - The Open Graph Viz Platform. Mapping Sense - DataViz' Toolkit.