
Python Object Graphs — objgraph 3.5.0 documentation. Objgraph is a module that lets you visually explore Python object graphs.
You’ll need graphviz if you want to draw the pretty graphs. I recommend xdot for interactive use. pip install xdot should suffice; objgraph will automatically look for it in your PATH. Quick start Try this in a Python shell: >>> x = []>>> y = [x, [x], dict(x=x)]>>> import objgraph>>> objgraph.show_refs([y], filename='sample-graph.png')Graph written to ....dot (... nodes)Image generated as sample-graph.png (If you’ve installed xdot, omit the filename argument to get the interactive viewer.) You should see a graph like this: If you prefer to handle your own file output, you can provide a file object to the output parameter of show_refs and show_backrefs instead of a filename.
Backreferences Now try >>> objgraph.show_backrefs([x], filename='sample-backref-graph.png')... And you’ll see Memory leak example The original purpose of objgraph was to help me find memory leaks. Python Object Graphs — objgraph 3.5.0 documentation. Wyplay/pytracemalloc: This project is no longer maintained here, instead, for Python < 3.4, please see ' maintained by Victor Stinner. Profiling. Memory-profiler. Memory Profiler This is a python module for monitoring memory consumption of a process as well as line-by-line analysis of memory consumption for python programs.
It is a pure python module which depends on the psutil module. Installation Install via pip: $ pip install -U memory_profiler The package is also available on conda-forge. To install from source, download the package, extract and type: $ python setup.py install Usage line-by-line memory usage The line-by-line memory usage mode is used much in the same way of the line_profiler: first decorate the function you would like to profile with @profile and then run the script with a special script (in this case with specific arguments to the Python interpreter). In the following example, we create a simple function my_func that allocates lists a, b and then deletes b: @profile def my_func(): a = [1] * (10 ** 6) b = [2] * (2 * 10 ** 7) del b return a if __name__ == '__main__': my_func() Ianozsvald/ipython_memory_usage: IPython tool to report memory usage deltas for every command you type.
Python Object Graphs — objgraph 3.4.1 documentation. SnakeViz. SnakeViz is a browser based graphical viewer for the output of Python’s cProfile module and an alternative to using the standard library pstats module.
It was originally inspired by RunSnakeRun. SnakeViz works on Python 2.7 and Python 3. SnakeViz itself is still likely to work on Python 2.6, but official support has been dropped now that Tornado no longer supports Python 2.6. Installation SnakeViz is available on PyPI. Profile and pstats — Performance Analysis — PyMOTW 3. The profile module provides APIs for collecting and analyzing statistics about how Python source consumes processor resources.
Note This output reports in this section have been reformatted to fit on the page. Lines ending with backslash (\) are continued on the next line. Running the Profiler The most basic starting point in the profile module is run(). Import profile def fib(n): # from literateprograms.org # if n == 0: return 0 elif n == 1: return 1 else: return fib(n - 1) + fib(n - 2) def fib_seq(n): seq = [] if n > 0: seq.extend(fib_seq(n - 1)) seq.append(fib(n)) return seq profile.run('print(fib_seq(20)); print()') This recursive version of a Fibonacci sequence calculator is especially useful for demonstrating the profile because the performance can be improved significantly.
The raw version takes 57359 separate function calls and 0.127 seconds to run. Not surprisingly, most of the time here is spent calling fib() repeatedly. Profile, cProfile, and pstats – Performance analysis of Python programs. The profile and cProfile modules provide APIs for collecting and analyzing statistics about how Python source consumes processor resources. run() The most basic starting point in the profile module is run().
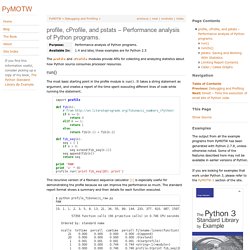
It takes a string statement as argument, and creates a report of the time spent executing different lines of code while running the statement.