
More plotting colours for MATLAB / Octave. Wavelet Software at Brooklyn Poly. 1. 2-D Filter Banks To use the wavelet transform for image processing we must implement a 2D version of the analysis and synthesis filter banks.
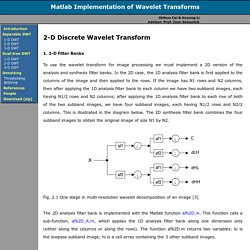
In the 2D case, the 1D analysis filter bank is first applied to the columns of the image and then applied to the rows. If the image has N1 rows and N2 columns, then after applying the 1D analysis filter bank to each column we have two subband images, each having N1/2 rows and N2 columns; after applying the 1D analysis filter bank to each row of both of the two subband images, we have four subband images, each having N1/2 rows and N2/2 columns. Index of /e161/dipum. A Wavelet Tour of Signal Processing. Example4. % 2D image analysis. % Load a test image.
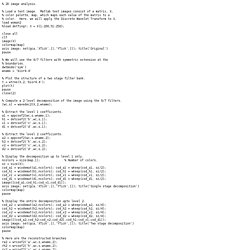
Matlab test images consist of a matrix, X, % color palette, map, which maps each value of the matrix to a % color. Here, we will apply the Discrete Wavelet Transform to X. load woman2 %load detfingr; X = X(1:200,51:250); close all clf image(X) colormap(map) axis image; set(gca,'XTick',[],'YTick',[]); title('Original') pause % We will use the 9/7 filters with symmetric extension at the % boundaries. dwtmode('sym') wname = 'bior4.4' % Plot the structure of a two stage filter bank. t = wtree(X,2,'bior4.4'); plot(t) pause close(2) % Compute a 2-level decomposition of the image using the 9/7 filters.
Bohr.wlu. Project: Jpeg2000-like wavelet based codec - Naotoshi Seo. Project: Jpeg2000-like wavelet based codec Overview Wavelet-based image coding has gone through significant advancement since the DCT-based codec became the first JPEG standard.
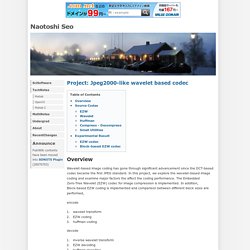
In this project, we explore the wavelet-based image coding and examine major factors the affect the coding performance. The Embedded Zero-Tree Wavelet (EZW) codec for image compression is implemented. In addition, Block-based EZW coding is implemented and comparison between different block sizes are performed, encode wavelet transformEZW codinghuffman coding decode inverse wavelet transformEZW decodinghuffman decoding Source Codes. MATLAB Central - compression score in wdencmp. What are newsgroups?
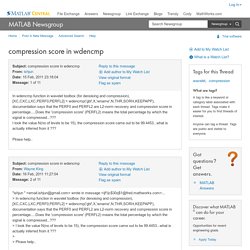
The newsgroups are a worldwide forum that is open to everyone. Newsgroups are used to discuss a huge range of topics, make announcements, and trade files. Discussions are threaded, or grouped in a way that allows you to read a posted message and all of its replies in chronological order. This makes it easy to follow the thread of the conversation, and to see what’s already been said before you post your own reply or make a new posting. Newsgroup content is distributed by servers hosted by various organizations on the Internet.
There are thousands of newsgroups, each addressing a single topic or area of interest. How do I read or post to the newsgroups? MATLAB Central - Wayne King. Changing size in imshow - MATLAB Answers - MATLAB Central. Learning Matlab for new and advanced users. Improving save performance. Two weeks ago I posted an article about improving fwrite‘s performance. fwrite is normally used to store binary data in some custom pre-defined format.
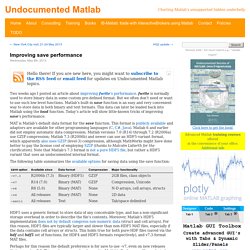
But we often don’t need or want to use such low-level functions. Matlab’s built-in save function is an easy and very convenient way to store data in both binary and text formats. This data can later be loaded back into Matlab using the load function. Today’s article will show little-known tricks of improving save‘s performance. MAT is Matlab’s default data format for the save function. The following table summarizes the available options for saving data using the save function: HDF5 uses a generic format to store data of any conceivable type, and has a non-significant storage overhead in order to describe the file’s contents.
Perhaps for this reason the default preference is for save to use –v7, even on new releases that support –v7.3. Undocumented Matlab. How to get rid of the white margin in MATLAB's saveas or print outputs. UPDATE (March 2014): For the updated version of this script, click here.
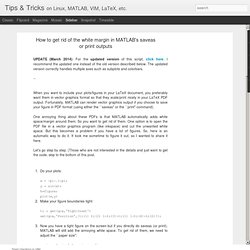
I recommend the updated one instead of the old version described below. The updated version correctly handles multiple axes such as subplots and colorbars. When you want to include your plots/figures in your LaTeX document, you preferably want them in vector graphics format so that they scale/print nicely in your LaTeX PDF output. Fortunately, MATLAB can render vector graphics output if you choose to save your figure in PDF format (using either the ``saveas" or the ``print" command). One annoying thing about these PDFs is that MATLAB automatically adds white space/margin around them.
Let's go step by step. If you want to understand the details of step 3, you need to look at ``Position" and ``TightInset" in Axes Properties, and ``PaperSize", ``PaperPosition" in Figure Properties. The code Download here Usage: saveTightFigure(h,'output.pdf'); Output format can be any format that MATLAB supports: jpeg, png, eps, pdf, etc. Matlab计算机视觉/图像处理工具箱推荐 - liuyue2046的专栏. 转自:

Importing/Exporting color themes for the MATLAB editor. Export_fig. Www.kui4.com. External Interfaces (MATLAB®)