
Commit History · panisson/pygephi_graphstreaming. Un graphe dynamique et interactif avec d3.js. D3.js - Data-Driven Documents. For teaching, research, and dissemination. This post lays out some of the importance of interactivity for network diagrams and we think is well worth a read (or at least a skim!)
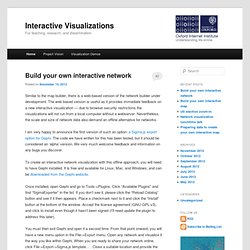
; however, if you wish to skip to the demos, these are linked at the end of the post. Visualizing network data is a prime example of a research activity where both desktop tools and online libraries exist, but are not well connected with one another. Desktop software like NodeXL and Gephi provide the ability to collect and visualize network data (users on Twitter, videos on YouTube, etc.). These applications, however, provide limited facilities for hosting, sharing, and optimizing visualizations for the web. Numerous technologies, frameworks and platforms exist for displaying network data online, but they often depend on bespoke data formats or a high degree of technical expertise. The visualization below shows the Twitter network of the Oxford Internet Institute (@oiioxford), and was produced without a single line of code needing to be written.
Visualising Advocacy. Facebook-class social network analysis with R and Hadoop. Social network analysis often amounts to calculating the statistics on a graph like this: the number of edges (friends) connected to a particular node (person), and the distribution of the number of edges connected to nodes across the entire graph.

When the graph consists of up to 10 billion elements (nodes and edges), such computations can be done on a single server with dedicated graph software like Neo4j. Datavisualization.ch Selected Tools. 22 outils gratuits pour visualiser et analyser les données (1ère partie) Vous avez des données à explorer ?
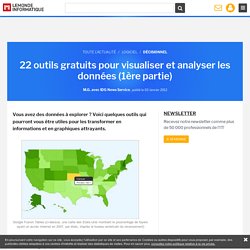
Voici quelques outils qui pourront vous être utiles pour les transformer en informations et en graphiques attrayants. Pour faire parler des données, rien ne vaut une panoplie d'outils de visualisation graphique. Il en existe de nombreux, notamment destinés aux professionnels versés dans l'analyse statistique. Mais leur prix, généralement élevé, ne convient pas aux utilisateurs moins spécialisés qui n'ont besoin qu'occasionnellement d'afficher des données sous une forme graphique.
Or, il existe, pour ceux dont le budget est limité, un nombre surprenant d'outils très intéressants pour la visualisation et l'analyse de données, accessibles gratuitement. Computerworld souligne que la correction des textes se fait simplement. DataWrangler (cliquer ici pour agrandir l'image) Refine intègre plusieurs algorithmes retrouvant les mots orthographiés différemment mais qui devraient en fait être regroupés. Python Data Analysis Library — pandas: Python Data Analysis Library.
Clustering - How to do community detection in a weighted social network/graph? - Statistical Analysis - Stack Exchange. Enterprise Software Doesn't Have to Suck: Social Network Analysis using R and Gephis. After learning the basics of R, I decided to learn something harder last week.
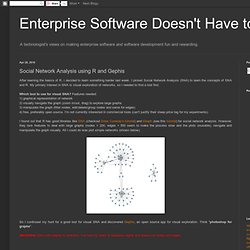
I picked Social Network Analysis (SNA) to learn the concepts of SNA and R. My primary interest in SNA is visual exploration of networks, so I needed to find a tool first. Which tool to use for visual SNA? Features needed: Overview — NetworkX 1.6 documentation. SocialAction. SocialAction is a social network analysis tool that integrates visualization and statistics to improve the analytical process.
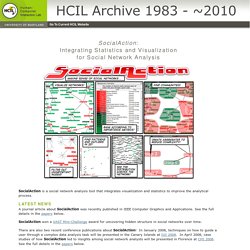
A journal article about SocialAction was recently published in IEEE Computer Graphics and Applications. See the full details in the papers below. Software for social network analysis. A comparative study of social network analysis tools. The Music Technology Playground from Last.fm. NETDRAW. Data Visualization Software. 22 outils gratuits pour visualiser et analyser les données (2ème partie)
La bibliothèque JavaScript InfoVis Toolkit propose des graphiques très peaufinés Vous avez des données à explorer ?
Voici quelques outils qui pourront vous être utiles pour les transformer en informations et en graphiques attrayants. Pour faire parler des données, rien ne vaut une panoplie d'outils de visualisation graphique. Pour ceux dont le budget est limité, il existe de nombreux outils gratuitement accessibles pour visualiser les données et faire apparaître des modèles ou des tendances. Au printemps dernier, Sharon Machlis, de Computerworld, en a listé plus de vingt, qu'elle a répartis en neuf catégories : nettoyage de données, analyse statistique, outils et services de visualisation (1ère partie publiée le 3 janvier), outils de développement, SIG, analyse de données temporelles, nuages de mots, visualisation de données relationnelles (2e partie).
NodeXL: Network Overview, Discovery and Exploration for Excel. A visual exploration on mapping complex networks. Find Your Influencers : KXEN. Find Your Influencers It’s no assumption that people socialize into groups.

By using business data, we can learn about the links between our customers and just as importantly, which customers have a strong social influence. We can use this insight to create a competitive advantage. Social Network Analysis for telecoms & gaming. Reduce Churn & Improve Marketing Front. DyNet Software. The purpose of the DyNet project is to develop the equivalent of a flight simulator for reasoning about dynamic networked organizations.
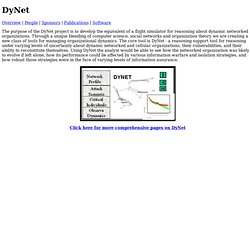
Through a unique blending of computer science, social networks and organization theory we are creating a new class of tools for managing organizational dynamics. The core tool is DyNet - a reasoning support tool for reasoning under varying levels of uncertainty about dynamic networked and cellular organizations, their vulnerabilities, and their ability to reconstitute themselves.
Using DyNet the analyst would be able to see how the networked organization was likely to evolve if left alone, how its performance could be affected by various information warfare and isolation strategies, and how robust those strategies were in the face of varying levels of information assurance. [CFinder] Clusters and Communities: Overlapping dense groups in networks. Commetrix - Dynamic Network Visualization Software - Dynamic Visualization of Networks - Dynamic Social Network Analysis Software Visualization - Dynamic Network Analysis - Virtual Communities. yEd - Graph Editor. yEd is a powerful desktop application that can be used to quickly and effectively generate high-quality diagrams.
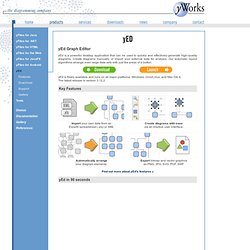
Create diagrams manually, or import your external data for analysis. Our automatic layout algorithms arrange even large data sets with just the press of a button. yEd is freely available and runs on all major platforms: Windows, Unix/Linux, and Mac OS X. The latest release is version 3.12.2 Key Features Import your own data from an Excel® spreadsheet (.xls) or XML Create diagrams with easevia an intuitive user interface. Automatically arrangeyour diagram elements. Export bitmap and vector graphicsas PNG, JPG, SVG, PDF, SWF. AnTools. Gephi. Home. Networks / Pajek.