
Free World Cities Database. Projection from Spheres. The stereographic projection is one way of projecting the points that lie on a spherical surface onto a plane.
Such projections are commonly used in Earth and space mapping where the geometry is often inherently spherical and needs to be displayed on a flat surface such as paper or a computer display. Any attempt to map a sphere onto a plane requires distortion, stereographic projections are no exception and indeed it is not an ideal approach if minimal distortion is desired. A physical model of stereographic projections is to imagine a transparent sphere sitting on a plane. If we call the point at which the sphere touches the plane the south pole then we place a light source at the north pole. Differential Equations - First Order DE's. In this chapter we will look at solving first order differential equations.
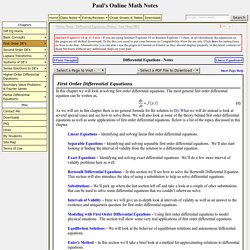
The most general first order differential equation can be written as, As we will see in this chapter there is no general formula for the solution to (1). What we will do instead is look at several special cases and see how to solve those. We will also look at some of the theory behind first order differential equations as well as some applications of first order differential equations. Below is a list of the topics discussed in this chapter. Linear Equations Identifying and solving linear first order differential equations. Solving Problems with Recursion. Recursion is a way to solve a problem by…reducing it to the same problem.
What? It may be counterintuitive, but many turn-based games (including chess) use exactly this technique to make a computer player “think.” Mohamed Saad explains the concept, along with when (and when not) to use recursion in your programming. Check out the Connect4 example! Recursion: Solving problems the recursive way In this article, I will introduce the concept of recursion, one of the most amazing programming constructs, as you will see.
Polar - rectangular conversion. How to convert rectangular coordinates to polar coordinates, and vice-versa.
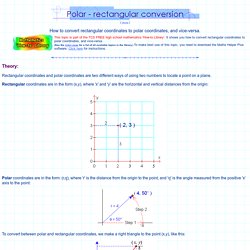
Theory: Rectangular coordinates and polar coordinates are two different ways of using two numbers to locate a point on a plane. Rectangular coordinates are in the form (x,y), where 'x' and 'y' are the horizontal and vertical distances from the origin: Polar coordinates are in the form: (r,q), where 'r' is the distance from the origin to the point, and 'q' is the angle measured from the positive 'x' axis to the point: To convert between polar and rectangular coordinates, we make a right triangle to the point (x,y), like this: 1.
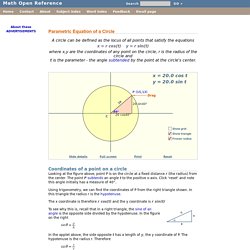
Parametric Equation of a Circle. A circle can be defined as the locus of all points that satisfy the equations x = r cos(t) y = r sin(t) where x,y are the coordinates of any point on the circle, r is the radius of the circle and t is the parameter - the angle subtended by the point at the circle's center.
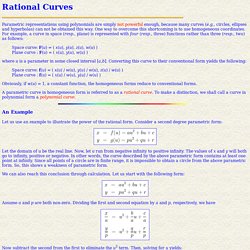
How to implement the discrete Fourier transform. Rational Curves. Parametric representations using polynomials are simply not powerful enough, because many curves (e.g., circles, ellipses and hyperbolas) can not be obtained this way.
Interpolation between curves. Computing Drawing - Part 1. Form2 - form2.pdf. Calcul intégral. Je vous propose quatre laboratoires pour vous familiariser avec les macro-commandes de base de Maple pour le Calcul intégral.
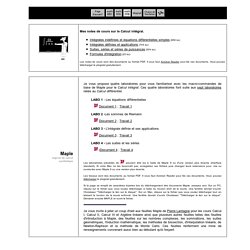
Ces quatre laboratoires font suite aux sept laboratoires reliés au Calcul différentiel. Les laboratoires précédés de peuvent être lus à l'aide de Maple 9 ou d'une version plus récente (interface standard). Si votre Mac ne les reconnaît pas, enregistrez ces fichiers puis changez leurs extensions pour .mw ou ouvrez-les avec Maple 9 ou une version plus récente. Les travaux sont des documents au format PDF. Si la page se remplit de caractères bizarres lors du téléchargement des documents Maple, essayez ceci. Blog. Saturday, 22 September 2012 @ 1658 GMT by Mukund Sivaraman BIND 10 is getting close to a formal alpha release soon.
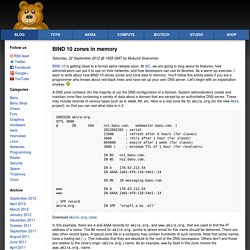
At ISC, we are going to blog about its features, how administrators can put it to use on their networks, and how developers can use its libraries. As a warm-up exercise, I want to write about how BIND 10 stores zones and zone data in memory. Image Processing for Dummies with C# and GDI+ Part 5 - Displacement filters, including swirl. Introduction Welcome again to my series on image processing.
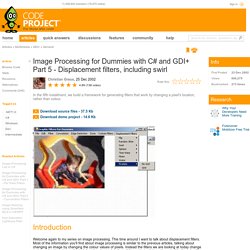
This time around I want to talk about displacement filters. Most of the information you'll find about image processing is similar to the previous articles, talking about changing an image by changing the colour values of pixels. Instead the filters we are looking at today change an image by changing each pixels location. I got a lot of email for my last article, asking why I bothered writing code to resize images. The framework. Tikz pgf - Draw a line between data points in two different pgfplots (subfigures) Discrete Fourier Transform with x axis data? Newest Questions - Page 6. Plotting - Marking points of intersection between two curves. Current community your communities Sign up or log in to customize your list. more stack exchange communities Stack Exchange sign up log in tour help Mathematica Ask Question Take the 2-minute tour × Mathematica Stack Exchange is a question and answer site for users of Mathematica.
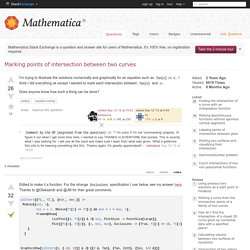
Marking points of intersection between two curves 3 Answers active oldest votes Your Answer Sign up or log in Sign up using Google Sign up using Facebook Sign up using Stack Exchange Post as a guest discard By posting your answer, you agree to the privacy policy and terms of service. Not the answer you're looking for? Linked Finding the intersection of a curve with an interpolation function Plotting discontinuous functions without spurious vertical segments Labeling points of intersection between plots.