

Bevalley, empowering enterprise social network users to work with data. The home of the WARG. eCommerce Analytics & Hosted Business Intelligence - RJMetrics. Microsoft BI. Capabilities Self-service Excel provides new self-service capabilities and empowers users with data discovery, analysis, and visual exploration.
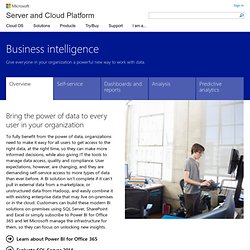
Uncover hidden insights and facilitate ease of collaboration and access from anywhere through HTML5 and mobile applications. Dashboards. Cloud: Editions.
Community. Vitria is excited to announce beta-testing of the world’s first Operational Intelligence applications (OI apps).

OI apps deliver out-of-the-box real-time insights into Big Data, events and business processes to drive rapid, informed decisions and actions on critical issues, such as KPIs, business process detection and customer experience. OI apps can be up-and-running in mere minutes, eliminating the need for time-consuming IT resources, giving you and your organization unprecedented time-to-value and ROI. Space is limited. Be the first to sign up and get value from OI Apps.
Join the beta program today. Vitria provided an exclusive preview of the world’s first OI app (KPI Builder App) at the TDWI Solution Summit in San Diego, CA from June 4-6, 2012. Watch the KPI Builder App demo video. TIBCO Spotfire - Business Intelligence Analytics Software & Data Visualization. Social Business Discovery - Collaborative Business Intelligence. Decisions aren’t made in isolation, they’re collaborative.
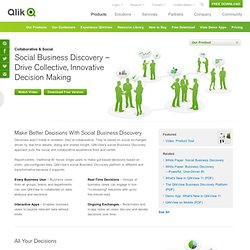
They’re based on social exchanges driven by real-time debate, dialog and shared insight. QlikView’s social Business Discovery approach puts the social and collaborative experience front and center. LogicMonitor. Call 888-415-6442 or email sales@logicmonitor.com for quote.
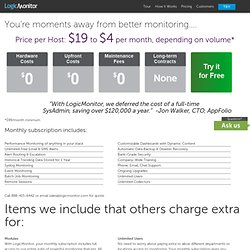
ModulesWith LogicMonitor, your monthly subscription includes full access to our entire suite of powerful monitoring features. All the intelligence you need is already built-in and made available to every customer at no additional cost. Interfaces Some monitoring systems charge per interface. For example, a switch with 80 interfaces would count as 80 probes being monitored. With LogicMonitor, even though we’d automatically discover and monitor all 80 interfaces, you’d only be charged for 1 device.
Unlimited Users No need to worry about paying extra to allow different departments or locations access to monitoring. Support Most monitoring products charge a substantial fee for support. Multiple Collectors If you have multiple locations, or want redundancy, you’re free to install as many collectors as you need at no additional cost. KPI Dashboard, Business Intelligence - Finance Dashboard. Free Dashboard for Social Analytics and Business Intelligence: InfoCaptor Enterprise.
S Platform Architecture. Next Gen Business Intelligence - Windward BI. What is AutoTag?

This important component of Windward’s reporting and document generation solutions lets you design, format and edit reports completely in Microsoft Office (AutoTag for Word and AutoTag for Excel). What Can You Do with AutoTag? Windward Design in a Familiar, Free-Form Interface Designing in Office means an end to “banded” reports with limited formatting. Place Your Data with Drag and Drop Drag and drop your data placeholders directly into your template with no coding required. Carry Your Styling across All Reports Streamline how you create multiple reports with fully supported Office styles.
Connect to Multiple Data Sources Simultaneously Connect to as many data sources as you need in a single report. Get Started Faster with Query Creation Wizards AutoTag query wizards are easy to use so you spend more time designing a report and less time figuring out how to create queries. Nucleon Software - Nucleon Software. ART - Web Reporting. Features Overview Provide live data via a web browser (table/crosstab, graphs, spreadsheets, pdf) Group queries/graphs in a single portal-like page (dashboards) Schedule queries, publish or send results via e-mail Build rules to dynamically filter query results based on user Drill Down, Cached Results, Enable your information via RSS Leverage on LDAP, Active Directory or other existing authentication systems Simple to install, administer and use Open, platform independent, free From a Simple Query to a Business Intelligence Solution Once an SQL query is ready, it can be published through ART in a few minutes.
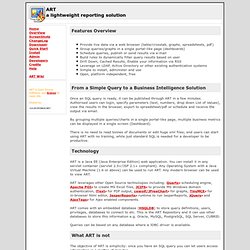
Authorised users can login, specify parameters (text, numbers, drop down List of Values), view the results in the browser, export to spreadsheet/pdf or schedule and receive the output via email. By grouping multiple queries/charts in a single portal-like page, multiple business metrics can be displayed in a single screen (Dashboard). Technology. dMine Dashboards & Business Intelligence. SaaS Business Intellegence, Secure Web Applications, Analysis Tools, Executive Dashboards, Actionable Data.
How much invaluable business information does your company have trapped in different systems?
Sales, production, inventory, salesperson performance and key customer metrics…all essential must-have data you need to profitably run your business. BizOptix enables you to access key business data - no matter where it’s housed - and configures the information to fit your business needs. It transforms the bits-and-bytes from your systems into Actionable Data that you and your entire team can view with point-and-click ease. If you can describe the business metrics you need, BizOptix will help you put the right data in the hands of decision makers across your entire organization.
Pricing. An Alternative to Spreadsheets.