
ZoteroBib. Research Tools By: Nader Ale Ebrahim. CAS Authentication wanted! Guides for the workplace and office. How to present your results. Educational Psychology. General explanations for calculating reliability indices are described below.
If you need help calculating correlations, click Calculating Inferential Statistics. Split-Half ReliabilityLike its name, the general idea of split-half reliability is that a test is split into two halves. Then the two halves are correlated to determine how reliable the instrument is within itself. (Because of recent advances in statistics, this isn't entirely how split-half reliability is calculated anymore, but the philosophy is still the same.) Because split-half reliability measures how internally consistent an instrument is, a reliability coefficient should be calculated separately for every variable that has two or more items to measure it. "Collecting data by in-depth interviewing" Collecting data by in-depth interviewing Presenter: Dr.
Rita S. Y. Berry Affiliation: University of Exeter & Hong Kong Institute of Education Home address: Flat H, 29/F, Block 52, City One Shatin, N.T., Hong Kong. Educational Research Methods. Math jokes collection by Andrej and Elena Cherkaev. The suggested collection of mathematical folklore might be enjoyable for mathematicians and for students because every joke contains a portion of truth or lie about our profession.
The selected jokes and sayings contain something essential about mathematics, the mathematical way of thinking, or mathematical pop-culture.We have slightly edited and systematized selected jokes, and added a few new ones. We are concerned that publication of sacral lecture jokes may endanger the respect to math. teachers in freshmen classes. Our excuse for this risky ethnographic research is that the majority of the jokes already exists on the Internet. Sometimes, people tend to attribute the jokes either to their beloved teachers (Peter Lax is so far the champion) or to legendary figures as Norbert Wiener or Paul Erdos; similarly, physical jokes are attributed to Albert Einstein or Niels Bohr and geometrical theorems - to Euclid. Teaching with primary sources.
When used effectively, primary sources can open a world of possibilities in the classroom.
When students have opportunities to approach sources as historians do, history becomes an art and a mystery — rather than a series of lifeless facts. This collection of materials offers ideas for integrating primary sources into your teaching, shares best practices, models the process of historical inquiry, and provides a selection of exemplary lesson plans. Learning from primary sources: Guides for students Reading guides and process guides Primary source analysis worksheets from NARA A series of worksheets for students to use when analyzing various primary source materials. Reading newspapers: Factual reporting This learner’s guide introduces students to the use of historical newspapers as primary sources and provides key questions for reading them. Reading newspapers: Reader contributions.
Using History to Teach Mathematics: An International Perspective - Victor J. Katz. Online-Calculator for testing correlations: Psychometrica. 1.
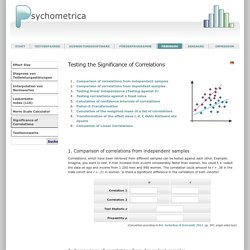
Comparison of correlations from independent samples Correlations, which have been retrieved from different samples can be tested against each other. Example: Imagine, you want to test, if men increase their income considerably faster than women. You could f. e. collect the data on age and income from 1 200 men and 980 women. The correlation could amount to r = .38 in the male cohort and r = .31 in women. (Calculation according to Eid, Gollwitzer & Schnmidt, 2011, pp. 547; single sided test) 2. If several correlations have been retrieved from the same sample, this dependence within the data can be used to increase the power of the significance test. 85 children from grade 3 have been tested with tests on intelligence (1), arithmetic abilities (2) and reading comprehension (3). (Calculation according to Eid et al., 2011, S. 548 f.; single sided testing) Reverse Coding a Likert Scale in Excel.
Language editors. Activity Theory. Classroom observations. CONFERENCES. Research. Hands on Writing: How to Master Academic Writing (in the Sciences) Are you struggling writing up your thesis, research paper or PhD proposal?
Are you tired of feeling anxious, stressed out and overwhelmed? If you are looking for guidance, structure, tools and strategies, plus a friendly and effective approach to your writing... Hands on Writing: How to Master Academic Writing in the Sciences A 6-Week Step-By-Step Online Course Features and Benefits Weekly Training Videos Watch them any time you like, as often as you need.
Downloadable Slides Annotate them as you watch the training videos or use them as a reference manual to assist you in your writing even after the course has ended. Worksheets and Checklists To help you put into practice all the strategies presented in the video training modules and keep track of your progress. Additional Resources To provide examples, inspirations and further thoughts.
Log in. When you hear a teacher's stories of classroom instruction, you hear the wisdom of practice through those stories.
Classroom stories are a valuable repository of practical knowledge. At LessonSketch we believe that those representations of practice may also provide context for developing capacity for instruction. The LessonSketch collections, tools, and online community are devoted to the creation, examination, and discussion of stories of instructional practice. Sign in and sign up for professional learning experiences where you can start exploring some of the classroom stories in our collection.
History of Mathematics.