
Daily Source, the good source. Utilities. Your Random Numbers – Getting Started with Processing and Data Visualization. Over the last year or so, I’ve spent almost as much time thinking about how to teach data visualization as I’ve spent working with data.

I’ve been a teacher for 10 years – for better or for worse this means that as I learn new techniques and concepts, I’m usually thinking about pedagogy at the same time. Lately, I’ve also become convinced that this massive ‘open data’ movement that we are currently in the midst of is sorely lacking in educational components.
The amount of available data, I think, is quickly outpacing our ability to use it in useful and novel ways. How can basic data visualization techniques be taught in an easy, engaging manner? This post, then, is a first sketch of what a lesson plan for teaching Processing and data visualization might look like. Let’s Start With the Data We’re not going to work with an old, dusty data set here. Even on a Saturday, a lot of helpful folks pitched in, and I ended up with about 225 numbers. It’s about time to get down to some coding.
OK. Data visualization with Processing, Part 1: An introduction to the language and environment. Although many open source projects are driven to build alternatives for existing applications, there are numerous projects that represent new and innovative works.
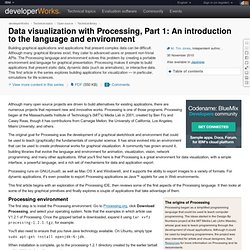
Processing is one of those programs. Processing began at the Massachusetts Institute of Technology's (MIT's) Media Lab in 2001, created by Ben Fry and Casey Reas, though it has contributions from Carnegie Mellon; the University of California, Los Angeles; Miami University; and others. The original goal for Processing was the development of a graphical sketchbook and environment that could be used to teach (graphically) the fundamentals of computer science. It has since evolved into an environment that can be used to create professional works for graphical visualization.
A community has grown around it, building libraries that evolve the language and environment for animation, visualization, vision, network programming, and many other applications. Processing environment The first step is to install the Processing environment. Data visualization tutorial in Processing. If you absolutely refuse to touch any code, I suggest Many Eyes or one of the fine FD sponsors, but if you're looking to get your hands dirty, Processing is a great place to start.

Jer Thorp, whose work we saw not too long ago, posts this introduction tutorial for data visualization with Processing. I’m going to start from scratch, work through some examples, and (hopefully) make some interesting stuff. One of the nice things, I think, about this process, is that we’re going to start with fresh, new data – I’m not sure what kind of things we’re going to find once we start to get our hands dirty. This is what is really exciting about data visualization; the chance to find answers to your own, possibly novel questions. The examples are straightforward, the results are interesting, and most importantly, it gives you a lot to work off of with your own data and geometry.
20 Fresh JavaScript Data Visualization Libraries. There are plenty of JavaScript libraries out there for rendering your otherwise plain and boring numerical data into beautiful, interactive, and informative visualizations.

The beauty of using JavaScript for data visualization is that, if created correctly, your data will be highly accessible (usually via HTML tables). A long time ago (2008), I wrote about JavaScript solutions for graphing and charting data and this article revisits the topic with twenty more JavaScript libraries that you can use to bring your data to life. 1. Highcharts Highcharts is one of the most promising JavaScript charting libraries to hit the scene recently, with its large array of features including seven charting types (line, pie, and bar among them), the ability to zoom in and out of charts, and tooltips for offering more information about data points. 2. gRaphaël gRaphaël is a charting library based on Raphaël, a vector graphics drawing JavaScript library. 3. 4. jQuery Visualize Plugin 5. moochart 6. 7. dygraphs.