
Interactive Map: Four Ways to Look at Carbon Footprints About this graphic Graphics by Stephen Rountree and Adam Marr Source: World Resources Institute CAIT 2.0 climate data explorer Emissions data and national boundaries are from 2010. For current emissions, per capita emissions, and intensity, the data are measured in tons of "carbon dioxide equivalent." That is, they include carbon dioxide and five other greenhouse gases (methane, nitrous oxides, hydrofluorocarbons, perfluorocarbons, and sulfur hexafluoride) as measured by their global warming potential. Cumulative emissions are measured in tons of carbon dioxide only. The emissions of Brazil and Indonesia may be understated because the numbers do not include calculations on land use change and forestry. There are high uncertainties in current measures of deforestation's contribution to greenhouse gas emissions, as international authorities work to develop a consistent methodology.
Getting the Picture | Home How Were Fossil Fuels Formed? Return to Challenges of Non-Renewable Energy This slideshow was produced by George Vibranz and Anne Glausser. Shale gas is a fossil fuel that formed millions of years ago. Different kinds of fossil fuels — coals, oils, and natural gases — formed as dead plants and animals decayed. Scientists refer to such remains as “organic matter.” This narrated slide show is part of our Challenges of Non-Renewable Energy series. Pre-viewing Questions What do you already know about fossil fuels? Focus Questions for Viewing How did shale form over time? Post-viewing Questions Scientists say that nearly all of the energy on Earth comes from the sun. Extension Activity Conduct research to find shale gas deposits that have been discovered near your state. Links to Learn More Make a Geologic Timeline , Ohio Department of Natural Resources: Geologic time is very difficult to think about in terms of a human lifetime. NGSS Correlations Category: Education, Energy, Environment, Geology
Footprint Basics - Overview Human activities consume resources and produce waste, and as our populations grow and global consumption increases, it is essential that we measure nature’s capacity to meet these demands. The Ecological Footprint has emerged as one of the world’s leading measures of human demand on nature. Simply put, Ecological Footprint Accounting addresses whether the planet is large enough to keep up with the demands of humanity. The Footprint represents two sides of a balance sheet. Biocapacity can then be compared with humanity’s demand on nature: our Ecological Footprint. Our current global situation: Since the 1970s, humanity has been in ecological overshoot with annual demand on resources exceeding what Earth can regenerate each year. It now takes the Earth one year and six months to regenerate what we use in a year. We maintain this overshoot by liquidating the Earth’s resources.
Earth Vision Institute | Earth Vision Institute, Founded by James Balog Extreme Ice Survey - Extreme Ice Survey Causes of Climate Change | Climate Change Key Points Both natural and human factors change Earth’s climate. Before humans, changes in climate resulted entirely from natural causes such as changes in Earth’s orbit, changes in solar activity, or volcanic eruptions. Since the Industrial Era began, humans have had an increasing effect on climate, particularly by adding billions of tons of heat-trapping greenhouse gases to the atmosphere. Most of the observed warming since the mid-20th century is due to human-caused greenhouse gas emissions. Earth’s temperature is a balancing act Earth’s temperature depends on the balance between energy entering and leaving the planet’s system . View enlarged image Models that account only for the effects of natural processes are not able to explain the warming over the past century. Changes in the greenhouse effect, which affects the amount of heat retained by Earth’s atmosphere Variations in the sun’s energy reaching Earth Changes in the reflectivity of Earth’s atmosphere and surface Radiative Forcing
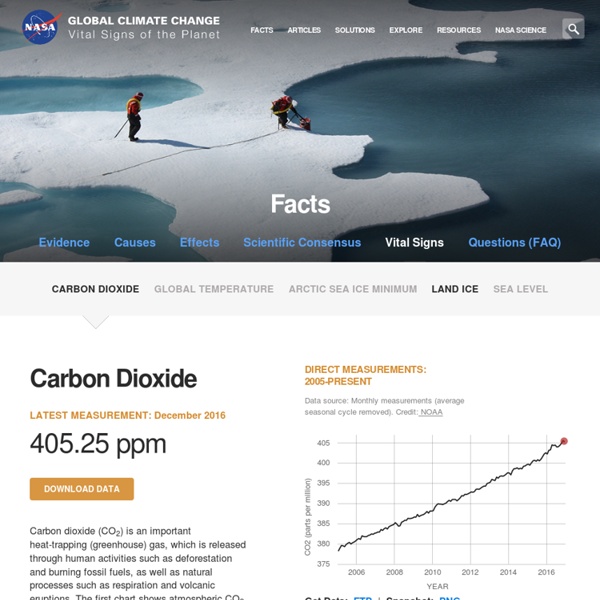
Story of Stuff Greenhouse gas benchmark reached For the first time since we began tracking carbon dioxide in the global atmosphere, the monthly global average concentration of this greenhouse gas surpassed 400 parts per million in March 2015, according to NOAA’s latest results. “It was only a matter of time that we would average 400 parts per million globally,” said Pieter Tans, lead scientist of NOAA’s Global Greenhouse Gas Reference Network. “We first reported 400 ppm when all of our Arctic sites reached that value in the spring of 2012. In 2013 the record at NOAA’s Mauna Loa Observatory first crossed the 400 ppm threshold. Reaching 400 parts per million as a global average is a significant milestone. Measuring greenhouse gases Patricio Eladio Rojas Ledezma, a Chilean meteorologist, collects air samples as part of NOAA's Global Greenhouse Gas Monitoring Network, on Easter Island, Chile, with a portable air sampler. NOAA bases the global carbon dioxide concentration on air samples taken from 40 global sites. Measuring gases at sea
Renewable Energy This Living Lab offers you a chance to evaluate the renewable energy sources in the U.S. Renewable energy comes from natural resources such as wind, plant material, water (rain or tides), geothermal, or sunlight and is naturally replenished. Both renewable and non-renewable energy sources are used to generate electricity, power vehicles, and provide heating, cooling, and light. Renewable sources of energy vary widely in their cost-effectiveness and in their availability across the United States. Wind Wind is kinetic energy - a mass of air moving with speed (or velocity). Biomass Biomass is potential energy found in living or recently living organisms (plants, animals, and their waste products). Hydro Flowing water creates energy called hydroelectric power or hydropower. Geothermal Geothermal energy is heat energy from the Earth’s core. Solar Solar power captures and converts the sun’s radiant energy into energy that can be used to power homes and industry.
The World's First Solar Road Is Producing More Energy Than Expected by Katie Valentine Posted on Share this: "The World’s First Solar Road Is Producing More Energy Than Expected" Share: CREDIT: SolaRoad In its first six months of existence, the world’s first solar road is performing even better than developers thought. The road, which opened in the Netherlands in November of last year, has produced more than 3,000 kilowatt-hours of energy — enough to power a single household for one year, according to Al-Jazeera America. “If we translate this to an annual yield, we expect more than the 70kwh per square meter per year,” Sten de Wit, a spokesman for the project — dubbed SolaRoad — told Al Jazeera America. De Wit said in a statement that he didn’t “expect a yield as high as this so quickly.” The 230-foot stretch of road, which is embedded with solar cells that are protected by two layers of safety glass, is built for bike traffic, a use that reflects the road’s environmentally-friendly message and the cycling-heavy culture of the Netherlands.
Global Warming Effects Map - Effects of Global Warming Climate Change and Game-Based Learning Teaching about complex interconnected systems like global climate change can be difficult. There are many unseen pieces affecting the greater whole that young people (and many adults) might not understand. One approach to lifting this conceptual curtain for students is assigning the BrainPOP video on the topic prior to class, flipping the instruction. Try BrainPOP's Make-a-Map tool, which is an open-ended concept map, a playful assessment, to have students demonstrate interconnections. Making Climate Change Games At a recent conference, I learned about EcoChains: Arctic Crisis. When students make their own climate-themed games, they will gain a deeper understanding of the topic. This spring I took part in Climate Game Jam: Water, organized by NOAA. Changing precipitation patterns Freshwater supply and sources Ocean acidification Polar issues Human use of water Marine/freshwater ecosystems There were also different game categories: Game Jamming to Learn About Complex Systems