
Le détail à valeur monumentale – 4 anecdotes interculturelles riches d’enseignement Turner, Mortlake Terrace, 1826. Le détail du petit chien noir apporte un équilibre remarquable en contrastant la luminosité de l’ensemble. Masquez-le avec le doigt et vous verrez combien le tableau perd en intensité. Le chien est d’ailleurs collé sur la toile et a été ajouté ultérieurement sur la toile. Un détail qui n’en est pas un Il suffit parfois d’un détail pour établir ou anéantir sa crédibilité, son autorité, la confiance, la relation interpersonnelle, et par conséquent pour décider du succès ou de l’échec d’un projet bien plus vaste. Un détail est la partie d’un ensemble. Mais quand le détail se rapporte à une dimension culturelle, il devient difficile à percevoir. Nous avons besoin de retours d’expérience et de grilles de lecture au sujet de ces détails à valeur monumentale. Cas 1 – Des Français en Norvège Situation Des Français se déplacent en Norvège pour présenter leur projet de coopération au partenaire local. Le détail interculturel - Tes mains. Pour prolonger Le temps passe.
Graphic: As Ebola's Death Toll Rises, Remembering History's Worst Epidemics Ebola is the latest in a long list of infectious disease outbreaks that have plagued humankind. The worst become pandemics, sweeping across continents and killing as many as tens of millions of people. Today, nations are struggling to get Ebola under control. How much higher this epidemic's death toll might climb remains to be seen. Jason Treat, NGM Staff; Edward Benfield. Plague of Justinian (541-542):This bubonic plague outbreak spread throughout the Byzantine Empire but centered on the Mediterranean region.
Map: Here's how much each country spends on food When droughts or crop failures cause food prices to spike, many Americans barely notice. The average American, after all, spends just 6.6 percent of his or her household budget on food consumed at home. (If you include eating out, that rises to around 11 percent.) Americans spend a smaller share of their income on food than anyone In Pakistan, by contrast, the average person spends 47.7 percent of his or her household budget on food consumed at home. The US Department of Agriculture's Economic Research Service keeps tabs on household expenditures for food, alcohol, and tobacco around the world. Americans, it turns out, spend a smaller share of their income on food than anyone else — less even than Canadians or Europeans or Australians: Note that the map above is based on data for food consumed at home — the USDA doesn't offer international comparisons for eating out, unfortunately. Below is a chart showing numbers for a handful of select countries. There are a few notable points here:
Leadership Styles Around The World Different cultures can have radically different leadership styles, and international organizations would do well to understand them. British linguist Richard D. Lewis charted these differences in his book "When Cultures Collide," first published in 1996 and now in its third edition, and he teaches these insights in seminars with major corporate clients. From structured individualism in the U.S. to ringi-sho consensus in Japan, the charts seem intuitively correct, if not unilaterally true across a country. Lewis acknowledges the risks of dealing in stereotypes: "Determining national characteristics is treading a minefield of inaccurate assessment and surprising exception. He argues that these patterns won't change any time soon: "Even in countries where political and economic change is currently rapid or sweeping, deeply rooted attitudes and beliefs will resist a sudden transformation of values when pressured by reformists, governments or multinational conglomerates." crossculture.com
Joutsenet opettavat:Tämä on pitkän parisuhteen salaisuus Ohjaaja Randy Moore halusi näyttää Walt Disney World -huvipuiston painajaismaailmana. Disneyltä ei lupaa olisi herunut, joten Moore teki elokuvan kysymättä. Nyt se näytetään Helsingin Night Visions -festivaaleilla. Keski-ikäinen perheenisä Jim käyskentelee Floridan kuulussa Walt Disney World -huvipuistossa perheensä kanssa. Stressaantunut isukki alkaa yllättäen nähdä puistossa outoja, pelottavia asioita. Pikkuhiljaa maskotit ja huvilaitteet muuttuvat yhä painajaismaisemmiksi ja todellisuus nyrjähtää. Yksi tiistaina alkavan Night Visions -elokuvafestivaalin oudoimmista tapauksista on yhdysvaltalainen Escape from Tomorrow (2013). Ohjaaja-käsikirjoittaja Randy Moore, 38, kertoo keksineensä idean elokuvaan – missäpä muualla kuin – Disney Worldissa. ”Kävin lapsena siellä isäni kanssa, kun vanhempani olivat eronneet. ”Mutta kun menin sinne aikuisena omien lasteni kanssa, kokemus oli aivan erilainen. Randy Moore. Niin syntyi Escape from Tomorrow’n käsikirjoitus. ”En tiedä.
Journée mondiale de l’alimentation : le dilemme des prix agricoles Le lien entre sécurité alimentaire et niveau des prix agricoles fait l’objet d’un intense débat parmi les économistes du développement. Lorsque les prix alimentaires sont élevés, les consommateurs sont touchés, l’accès à la nourriture diminue. Lorsque les prix agricoles s’effondrent, les agriculteurs ne gagnent pas suffisamment pour investir sur leur exploitation et produire davantage ; la disponibilité de nourriture est compromise. Accès versus disponibilité : la Journée mondiale de l’alimentation, le 16 octobre, offre l’occasion de revenir sur cette apparente contradiction. Un premier constat s’impose. Evolution des prix alimentaires internationaux en valeur réelle et de la prévalence de la sous-alimentation dans les régions en développement Des chercheurs ont poussé plus loin le raisonnement en prenant en compte les répercussions des prix agricoles sur l’ensemble de l’économie, via le marché du travail. Commentaires : Excellent article. Oui cette journée mondiale serait la bienvenue !
The Lewis Model interaktiivinen kartta liikalihavuudesta alueellisesta ilmenemusestä Yhdysvalloissa Click image above to view slideshow There’s no hiding a bulging waistline. And thanks to a new interactive U.S. map, there’s no concealing the state-by-state status of the obesity epidemic. While a rise in obesity is evident in all states, the graphics make clear that some regions have more work cut out for them.
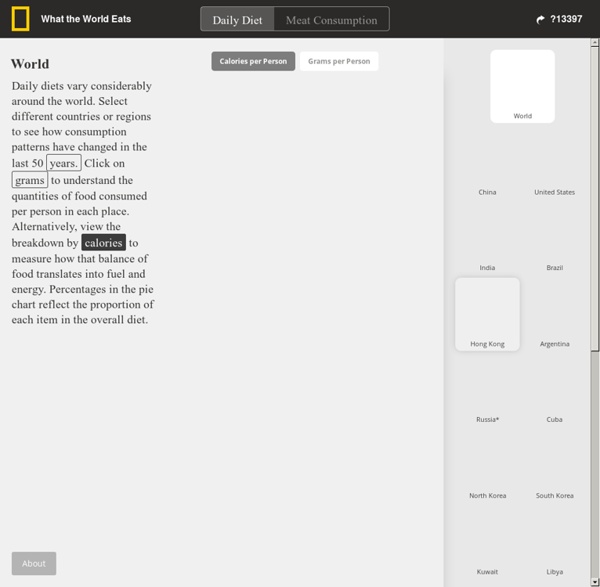
America gets 37% of its calories from sugar and fat. China gets 11%. People today are eating a lot more than their grandparents did. The amount of calories available for each person in the world has risen 28 percent in the last 50 years. But there's still a ton of variation between countries. Indians eat less meat than most. National Geographic recently created a great interactive visualization of the world's dietary habits, breaking down what each country eats in detail. 1) 37% of calories in the American diet come from sugar and fat Number in the middle shows total calories available per person in 2011. In 2011, the amount of food available for consumption in America came to about 3,641 calories per person per day, on average. What's striking is that 37 percent of those calories came from sugar and fat — nearly double the global average. The main factor here is vegetable oils — which provide 19 percent of calories in the American diet. 2) The average Chinese person now eats more meat than the average American (National Geographic) Further reading
VU DU ROYAUME-UNI • Pourquoi tant de haine contre les Français ? Habitude millénaire devenue sport national, le French bashing se porte bien outre-Manche. Les propos d'un patron anglais viennent encore de le démontrer. Un chroniqueur britannique s'élève contre cette pratique somme toute assez vaine, juge-t-il. Bon, respirons un grand coup et allons-y... PolitesseC'est pourtant ce genre de salves que des Anglophones lancent quotidiennement contre la France. Sur place, il a déclaré : "Rien ne marche et, pire, ça ne dérange personne." Ennemi héréditaire Son analyse a fait beaucoup de bruit, mais elle n'a en réalité rien d'exceptionnel. Pour autant que je sache, nous ne nourrissons pas de tels sentiments à l'égard des autres pays. Propos débiles Ce qui est sûr, c'est que les Français sont sidérés. L'autre raison de leur sidération est que les propos tenus sont souvent débiles. La France en accueille beaucoup plus de visiteurs que les autres pays, près de 85 millions en 2013, et les Britanniques représentent 15 % de cet ensemble.