
The cheat sheet to choosing effective education apps Getting students active in the classroom is a tough task for any teacher. But there’s a silver bullet that is, quite literally, silver. It’s the Apple iPad and this expensive, silver, and engaging device is making its way into classrooms around the world. Since there’s such a push to bring apps into the classroom, it’s time to figure out which ones are right for you. So what are some of the best education apps for active learning? This cheat sheet will help – but first let’s run through the questions you see in the visual. Questions To Ask When Testing Apps For The Classroom In an attempt to uncover what works, I combed through a few hundred apps and analyzed them by asking the following questions: How easy is this app to use for less tech-savvy students and teachers? There are, of course, many other questions to consider when trying out an iPad app (or any other smart device app) for classroom usage. So, What’s Next? The cheat sheet to choosing effective education apps You’re in luck!
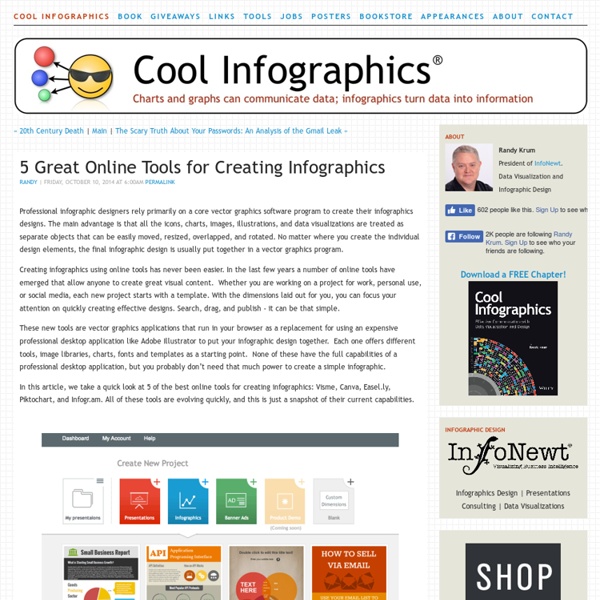
14 Tools to Create Engaging Infographics and Images for Social Media Posts | Belle Beth Cooper It's no secret that images are increasingly important for social media success. It wasn't long ago that Twitter added inline image previews to its official apps, and it's including even more image focus in the latest redesign. At Buffer, we've done tests on our own Twitter account previously that showed images make a huge difference to engagement: In a recent research study we conducted, we found that images can increase retweet rate by up to 150%: Images aren't just useful for Twitter, either. To make the visual side of your social media strategy a bit easier, here are some tools to help you create awesome pictures. 1. PicMonkey is a really easy-to-use photo editing tool that runs in your browser. I love how easy-to-use PicMonkey is, and that you can jump in straight away and give it a go without creating an account or even uploading your own photos. It even has some handy built-in collage designs for Pinterest, Etsy and Facebook: 2. 3. 4. 5. 6. Easel.ly Infogr.am Visual.ly Piktochart 7. Recite
10 Types of Infographics: Which Works For You? Do you have your next big infographic idea but know how to get it on paper? Do you have all the data you need but aren’t sure how to visualize it? Creating a really cool, memorable and–above all–shareable infographic comes down to investing the necessary time and attention in all the steps that lead up to an awesome data visualization. In a previous series of posts, we discussed the steps to creating your own infographic. ChronologicallyAlphabeticallyGeographicallyCategoricallyHierarchically The visual format you choose will depend on how you want to organize your information. 1 Mixed charts Source: MHPM As its name implies, this type of infographic incorporates different chart and graph formats. This mixed bag of charts and graphs is the best option when you have many statistics, facts and figures to communicate to your audience. 2 Informational / List Business 2 Community Another common type of infographic is the list-based or informational visual. 3 Timeline Funders and Founders 4 How-to
The Twitteraholic’s Ultimate Guide to tweets, hashtags, and all things Twitter Most educators who learn to use Twitter effectively say they learn more from their personal learning network (PLN) on Twitter than they’ve achieved from any other forms of professional development or personal learning. Unfortunately educators often dismiss Twitter, or fail to see the value of Twitter, when they’re first introduced to Twitter. Our aim of this post is to provide all the information you need to learn how to use Twitter effectively as an educator. We regularly update this post with new information. This post was last updated June, 2014. Click on a link below to go to the section you want to read: About the Twitter-a-holic’s Ultimate Guide The original Twitter-a-holic’s Guide was published in July, 2010 when I’d just returned from attending a large conference overseas and realized that while a conference can make you feel really overwhelmed and alone — especially amongst the 13,000 ed tech professionals participants who attend it each year — I never felt alone. Why? Back to Top 1.
Vizualize.me: Visualize your resume in one click. Gapminder: Unveiling the beauty of statistics for a fact based world view. Top 10 Free Content Curation Tools For Teachers - eLearning Industry Summary: Finding educational content in the web is no big deal- but managing it, is. Educational content curation is the art – rather than the act – of sorting out the vast amounts of educational content on the web and organizing them around a specific educational topic in a coherent way. General speak all teachers are educational information curators, or should be. Modern web tools help both students and teachers to contribute online discoveries to class conversations. Create the best Course for your School with the Right Vendor Find, choose and compare the top eLearning Content Development Companies for K12! eLearning Tags At eLearning Tags you can share, discover, vote and discuss interesting and remarkable eLearning and Educational Technology content. eLearning Tags offers helpful information on a number of topics concerning distance education including eLearning, Instructional Design, Gamification, Social Learning, MOOCs, mLearning and more.
Create infographics and online presentations | Sprites Rubrics for Assessment Teachers who integrate technology into student activities and projects often ask us this question - “How do I grade it?” Fundamentally, assessing multimedia activities and projects is no different than evaluating traditional assignments, such as written essays. The primary distinctions between them are the unique features and divergent possibilities associated with their respective medium. For instance, a blog has a unique set of possibilities (such as hypertext, embedded video, interactive imagery, etc) vastly different than those of a notebook (paper and pen notes and drawings within a contained document). The first thing to realize is that you cannot separate the user from the device. iPads, Chromebooks, and tech tools themselves don’t demonstrate great learning; it’s about what students do with the technology that matters.
Beyond PowerPoint & Keynote: The 20 Best Apps to Create and Share Presentations - The Zapier Blog The latest presentation apps have made it easier than ever to format slides and create professional-looking slideshows without giving off a "this is a template" vibe. Even standard PowerPoint alternatives have updated key features to make it easier than ever to collaborate and create presentations quickly, so you can spend more time prepping for your actual presentation. If, like me, you've been using Google Slides unquestioningly for years, it's a whole new world out there. The newest crop of online presentation tools go way beyond the classic slideshow experience, with new features to keep your audience's attention, streamline the creation process with AI, and turn slide decks into videos and interactive conversations. I've been testing these apps for the past few years, and this time, I spent several days tinkering with the top presentation software solutions out there to bring you the best of the best. The best presentation software What makes the best presentation app? Canva pros:
Echo360 Events | Conferences, Webinars, User Meetings Supporting STEM with Active Learning Technology: How UT Martin is Successfully Expanding STEM to Students in Rural Areas Instructors and technologists from UT Martin describe how they leverage lecture capture technology to promote active learning in face-to-face, online and hybrid STEM courses. Learn how they creatively use captured content for peer mentoring, distance courses, student review and more. Air Date: September 26, 2013 Craig Ingram, Director, Instructional Technology Center, UT Martin Paula Gale, Professor/Assistant Director, Agriculture, Geosciences, & Natural Resources, UT Martin Bruce Harrison, IT Administrator IV, Senior Systems Administrator, Video Engineer, UT Martin Kate Stumpo, Assistant Professor, Chemistry and Physics, UT Martin Peggy Davis, Assistant Professor, Nursing, UT Martin Bob Bradley, Instructor, Computer Science, UT Martin David Ray, Instructor, Mathematics and Statistics Harriette Speigel, Instructional Technologist, UT Martin View Webinar
Comment facilement élaborer un SlideShare qui tient la route ? Personnellement, je suis toujours un peu réticent à lancer PowerPoint quand vient l'heure de réaliser des slides de présentation. Je ne m'y sens pas à l'aise. Cette police par défaut, calibri noire sur fond blanc.. hiiieuuuhh.. berk.. détruisant définitivement cette étincelle de créativité qui me faisait vibrer ce matin. C'est déjà bien assez compliqué de présenter à sa direction 10 slides qui ressemblent à quelque chose. Bon, c'est vrai que j'utilise de moins en moins PowerPoint et de moins en moins les produits de Microsoft mais cela ne m'aide pas à réaliser des présentations correctes. Et quand on a l'ambition de potentiellement s'adresser à 60 millions de visiteurs uniques sur SlideShare, autant ne pas se louper ! Avant d'aborder ensemble les 10 étapes vers une présentation SlideShare facile à faire mais qui tient largement la route, je vous propose de télécharger quelques templates mis à disposition par HubSpot. Commencez tout d'abord par choisir les grands thèmes.
SlidesCarnival, free presentation templates for Google Slides & Powerpoint