
Ed Tech Teacher Tool Dashboard We're here to help! Looking for a Place to Begin? Start here! Frameworks & Models How we frame our thinking about teaching with technology. Tutorials and Helpful Links Our video library, favorite blogs, and preferred online resources. Innovative Projects and Lessons Exemplars of great teaching and learning with technology. Tech Tools by Subject and Skill Web Tools and Resources organized by subject, topic, and activity. Free Live Webinars & Recordings Ideas for the classroom from our instructors and guest presenters. Google Apps for Education Tips, strategies, and resources for "Going Google" App Recommendations Apps for your students organized by learning activity and device. Assessment and Rubrics Grading resources for formative and summative assessment New Tips and Strategies Posted Weekly on our Blog Share this: Bring podcasting to your classroom Using Opinion Podcast from @Mr_Sondgeroth 1 day ago 16 hours ago 18 hours ago 19 hours ago Contact Information
Lightning Fatalities, Injuries, and Damage Reports in the United States - National Lightning Safety Institute Section 3.1 The following maps and tables show state-by-state lightning deaths from 1990 to 2003 based on Storm Data compiled by Ronald L. Holle, Meteorologist/Consultant at Vaisala Inc. He notes there is a continuing shift to the south and west in death rates caused by lightning. Number of Lightning Deaths in the United States, 1990-2003 Number of Lightning Deaths in the United States, 1990 to 2003 Note: One death each occurred in Guam and the U.S. Lightning Deaths in the United States Weighted by Population, 1990 to 2003 Lightning Deaths in the United States Weighted by Population, 1990 to 2003 The lightning fatality data were collected by NOAA (National Oceanic and Atmospheric Administration). Statistics for the earlier period from 1959 to 1994 are included in the following article: Curran, E.B., R.L.
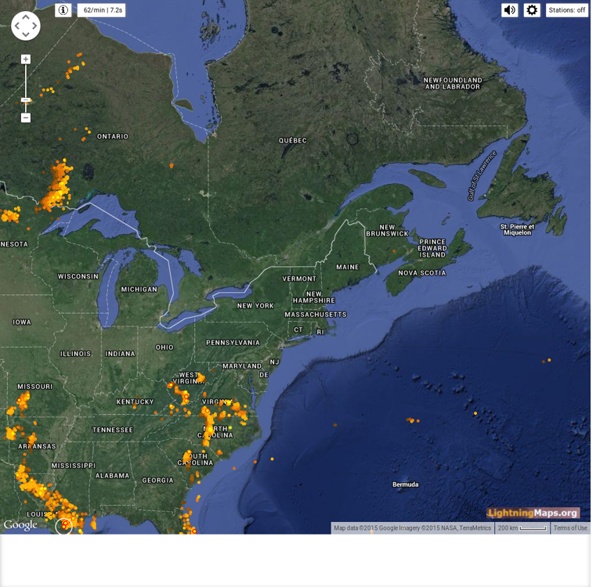
earth :: a global map of wind, weather, and ocean conditions Digital slidebooks for student creativity, self-expression, and imagination - Biteslide 59-13_State_Ltg_Fatalities.pdf India Solar Resource Data: Hourly These data and software code ("Data") are provided by the National Renewable Energy Laboratory ("NREL"), which is operated by the Alliance for Sustainable Energy, LLC, ("Alliance") for the U.S. Department of Energy ("DOE"), and may be used for any purpose whatsoever. The names DOE/NREL/ALLIANCE shall not be used in any representation, advertising, publicity or other manner whatsoever to endorse or promote any entity that adopts or uses the Data. DOE/NREL/ALLIANCE shall not provide any support, consulting, training or assistance of any kind with regard to the use of the Data or any updates, revisions or new versions of the Data.
New Technologies and 21st Century Skills What is lightning? - science made simple science made simple Clouds may look fluffy and innocent, but they are actually active places. At their most exciting, they can create the wondrous effect of lightning. How is lightning formed? Water and ice move around inside the cloud; forced up by warm air currents, down by gravity, and compressed in the cloud. Once a significant charge separation has built up, the positive and negative charges seek to reach each other an neutralise. As the negative charge races down, the air surrounding it heats up.The spark is very hot at almost 20,000 degrees Celsius, and it rapidly heats the air to create a shock wave. Considering light travels very fast – about 300 million metres per second, and that sound only travels at 300 metres per second; light is a million times faster than the sound produced. Here is a slow motion video of lightning. Watch closely and you will see the step leaders heading down from the cloud. Lightning facts
Welcome to the World Radiation Data Centre's Home Page Excellent Tool to Create Rubrics for Your Class November, 2014 Rubistar is a great free web tool that teachers can use to create educational rubrics to use in class. By definition, a rubric according to Geidi Andrade, is "a document that articulates the expectations for an assignment by listening the criteria, or what counts, and describing levels of quality from excellent to poor". As a teacher you can create rubrics and use them for a variety of purposes. Rubistar is very simple and easy to use.
Weather Wiz Kids weather information for kids Lightning What is lightning? Lightning is a bright flash of electricity produced by a thunderstorm. All thunderstorms produce lightning and are very dangerous. If you hear the sound of thunder, then you are in danger from lightning. What causes lightning? Have you ever rubbed your feet across carpet and then touched a metal door handle? Click Here to see where lightning is currently striking across the U.S.How hot is lightning? What causes thunder? How far away can you see lightning and hear thunder? What is intracloud lightning? What is intercloud lightning? What is sheet lightning? What is heat lightning? What is high-altitude lightning? What is St. Know the Lingo SEVERE THUNDERSTORM WATCH - A severe thunderstorm (damaging winds of 58 miles per hour or more, or 1" hail in diameter or greater) is likely to develop in your area. Know the Facts A lightning flash is no more than one inch wide. Lightning Safety Tips IF YOU’RE OUTDOORS: Keep an eye at the sky. IF YOU’RE INDOORS: Avoid water.
Climatological Data for the World - Weather and Climatology - Library Guides at UChicago Directories of Countries National Meteorological or Hydrometeorological Services of MembersList of members of the World Meteorological Organization with links to national services websites containing observations. UNDP Climate Change Country Profiles Each report contains a set of maps and diagrams demonstrating the observed and projected climates of that country. A narrative summarizes the data in the figures. A dataset containing the underlying observed and model data for that country, is made available for use in further research projects in text format which can easily downloaded, read and manipulated. Canada National Climate Data and Information Archive Canadian Meteorological Centre Monthly Meteorological Summary (QC985.5.O6A2 Crerar Library - print) Monthly Record: Meteorological Observations in Canada Great Britain and UK
untitled
dünya üzerindeki bütün şimşek ve yıldırımları gerçek zamanlı olarak haritaya düşüren site. by orbitalderaks Jun 29