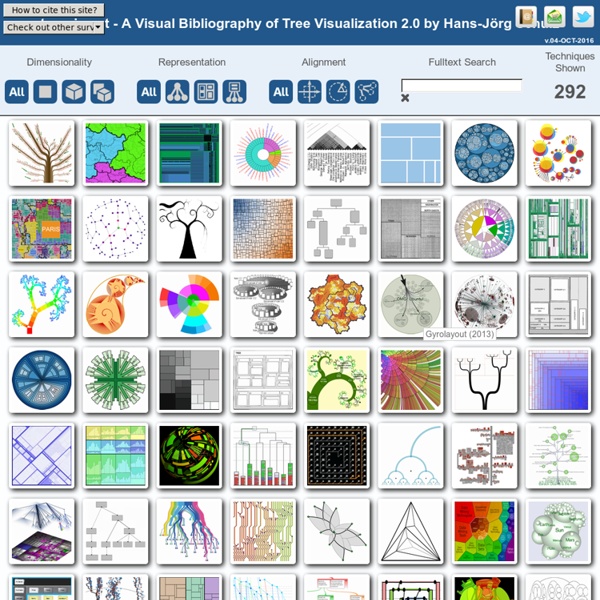
A Visual Survey of Tree Visualization
d3.js
NLTK Stemming and Lemmatization Demo | Python NLTK | Stemming | Lemmatization | Python NLTK Demo
Stemming is a process of removing and replacing word suffixes to arrive at a common root form of the word. English Stemmers and Lemmatizers For stemming English words with NLTK, you can choose between the PorterStemmer or the LancasterStemmer. The Porter Stemming Algorithm is the oldest stemming algorithm supported in NLTK, originally published in 1979. The Lancaster Stemming Algorithm is much newer, published in 1990, and can be more aggressive than the Porter stemming algorithm. Non-English Stemmers Stemming for Portuguese is available in NLTK with the RSLPStemmer and also with the SnowballStemmer. Snowball Stemmers Snowball is actually a language for creating stemmers, and was added to NLTK version 2.0b9 as the SnowballStemmer class. DanishDutchEnglishFinnishFrenchGermanHungarianItalianNorwegianPorterPortugueseRomanianRussianSpanishSwedish
Related:
Related: