

Source Code & Tutorials Recently, I have released source code for a number of projects. In most cases these projects are released as they were published – while the code is reasonably well-commented, the projects weren’t build specifically to be released and thus may not be shining examples of standards and software architecture. That said, I hope that these releases will serve as inspiration for you to make some things of your own. If you do end up building something interesting, please let me know. Source Code Processing Kepler Visualization[post][GitHub]tree.gowth [post][project][download]GoodMorning! ActionScript 2 Variance [post][project][download]smart.rockets [post][project][download]Particle Swarm Optimization [download] Except where otherwise noted, all source releases are licensed under the CC-GNU GPL version 2.0 or later. Tutorials In addition to source releases, I have also written a number of tutorials designed to help people learn how to use code in a creative context.
The Best Tools for Visualization Visualization is a technique to graphically represent sets of data. When data is large or abstract, visualization can help make the data easier to read or understand. There are visualization tools for search, music, networks, online communities, and almost anything else you can think of. Whether you want a desktop application or a web-based tool, there are many specific tools are available on the web that let you visualize all kinds of data. Here are some of the best: Visualize Social Networks Last.Forward: Thanks to Last.fm's new widget gallery, you can now explore a wide selection of extras to extend your Last.fm experience. Last Forward Friends Sociomap: Friends Sociomap is another Last.fm tools that generates a map of the music compatibility between you and your Last.fm friends. Fidg't:Fidg't is a desktop application that gives you a way to view your networks tagging habits. Fidg't The Digg Tools: One more: Digg Radar . YouTube: Visualize Music Musicovery Last.fm music visual tools: Amazon Data
Software Tools Open Source Licenses Non-Commercial Binary Licenses Non-Commercial Source Licenses You are welcome to download and use the software tools appearing on this page that have been developed by AT&T Labs researchers. Please reference the individual project web pages for specific license agreements. In addition to the software tools available through Open Source and Non-Commercial licenses as listed on this page, AT&T has additional software and technology solutions available for licensing. AST: Advanced Software Technologies Open Source Collection AST (AT&T Software Technology) OpenSource software is a collection of libraries and commands for UNIX and Windows. Some of the more popular components include: cdt, dss, ksh93, nmake, pax, sfio, vcodex, and vmalloc. CDT: Container Data Types Library A Container Data Type library. ECharts: A state machine-based programming language FastRWeb: FastRWeb is an infrastructure for web-based reporting, data analysis and visualization using R.
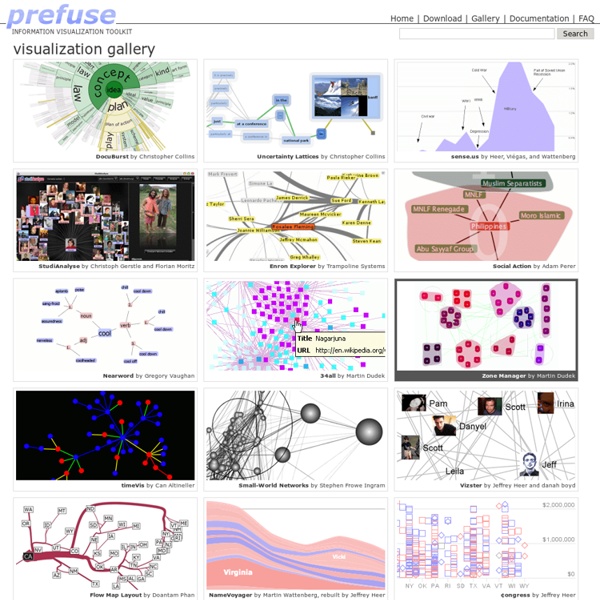
Gapminder: Unveiling the beauty of statistics for a fact based world view. 38 Tools For Beautiful Data Visualisations | Elisa DBI As we enter the Big Data era, it becomes more important to properly expand our capacity to process information for analysis and communication purposes. In a business context, this is evident as good visualisation techniques can support statistical treatment of data, or even become an analysis technique. But also, can be used as a communication tool to report insights that inform decisions. Today there are plenty of tools out there that can be used to improve your data visualisation efforts at every level. Javascript Libraries Circular Hierarchy – D3.js Python Libraries Kartograph.py – Mapsigraph – Node-link, treesMatplotlib – Most types of statistical plotsPycha – Pie chart, bar chart, area chartNetworkX – Node-link Java / PHP Prefuse – Area chart, Time series, node-link, tree, timeline, steam graph, radial hierarchyJpGraph – Line plot, scatter plot, bar chart, bubble chart, contours chart, field chart, splines, pie chart, boxplot, polar plot, radial chart, maps Web Applications