
Visualizing 50 years of The Rolling Stones An interactive map of their live-show story. British tour The Rolling Stones 1963 British Tour was the first Rolling Stones concert tour. The tour commenced on September 29 and concluded on November 3, 1963. 2,812km. 1st British Tour The Rolling Stones 1964 1st British Tour was a concert tour. 1,438km. 2nd British Tour The Rolling Stones 1964 2nd British Tour was a concert tour. 4,063km. 3rd British Tour The Rolling Stones 1964 3rd British Tour was a concert tour by the band. 2,120km. Irish Tour The Rolling Stones 1965 Irish Tour was the first concert tour of Northern Ireland and Ireland by The Rolling Stones. 358km. Far East Tour The Rolling Stones 1965 Far East Tour was the first concert tour of Oceania by the band. 16,016km. The Rolling Stones 1965 1st British Tour commenced on March 5 and concluded on March 18, 1965. 1,252km. 1st European Tour The Rolling Stones 1965 1st European Tour was the first concert tour of Scandinavia by the band. 768km. 1st American Tour 25,952km. 2nd European tour 0km. 138km.
Women as Academic Authors 1665-1970321,368 authors 1971-1990609,635 authors 1991-20101.1 million authors All years2.0 million authors Anthropology 27.2% female authors(45,099 authors) 32 subfields Classical studies 19.6% female authors(21,069 authors) 22 subfields Cognitive science 30.2% female authors(17,584 authors) 6 subfields Demography 32.5% female authors(15,201 authors) Ecology and evolution 18.5% female authors(427,476 authors) 24 subfields Economics 9.7% female authors(129,059 authors) 16 subfields Education 37.2% female authors(56,299 authors) 21 subfields History 20.4% female authors(39,931 authors) 38 subfields Law 13.1% female authors(53,160 authors) 23 subfields Mathematics 6.6% female authors(19,547 authors) 30 subfields Molecular & Cell biology 26.7% female authors(392,159 authors) 39 subfields Mycology 21.5% female authors(10,251 authors) 14 subfields Operations research 7.6% female authors(11,321 authors) 11 subfields Organizational and marketing 19.7% female authors(50,811 authors) 5 subfields Philosophy 35 subfields Plant physiology
The Internet map The map of the Internet Like any other map, The Internet map is a scheme displaying objects’ relative position; but unlike real maps (e.g. the map of the Earth) or virtual maps (e.g. the map of Mordor), the objects shown on it are not aligned on a surface. Mathematically speaking, The Internet map is a bi-dimensional presentation of links between websites on the Internet. Charges and springs To draw an analogy from classical physics, one may say that websites are electrically charged bodies, while links between them are springs. Also, an analogy can be drawn from quantum physics. Anyway, the real algorithm of plotting The Internet map is quite far from the analogies given above. Semantic web The map of the Internet is a photo shot of the global network as of end of 2011 (however, baloons show actual statistics from Alexa). Importantly, clusters on the map are semantically charged, i.e. they join websites together according to their content. The Internet Phenomenon Ideas and suggestions
Pedestrian Monitoring System Sunday 30 September 2012 Trend over last 3 hours Note: If a sensor returns a series of zero readings it may be temporally inoperable 6am Sunday 30 September 2012 Yellow Above average by 10% or moreGrey Average Green Below Average by 10% or more * Average calculated from same day & hour over the previous 4 weeks Pedestrian Counting The City of Melbourne's 24-hour pedestrian counting system measures pedestrian activity in the city each day. The system counts pedestrian movements to give the City of Melbourne a better understanding of how people use the city so we can manage the way they function and plan for future needs. The online visualisation tool is an interactive map of these sensor locations, which enables users to see pedestrian counts on particular dates and times and compare data. Interact Click on the screenshots below to understand the interactive elements of the visualisation, and how the data is represented on a selected date. Events in the city Share or Download data files
The Big Mac index Prime Number Patterns by Jason Davies. For each natural number n, we draw a periodic curve starting from the origin, intersecting the x-axis at n and its multiples. The prime numbers are those that have been intersected by only two curves: the prime number itself and one. Below the currently highlighted number, we also show its sum of divisors σ(n), and its aliquot sum s(n) = σ(n) - n, which indicate whether the number is prime, deficient, perfect or abundant. Based on Sobre el patrón de los números primos by Omar E.
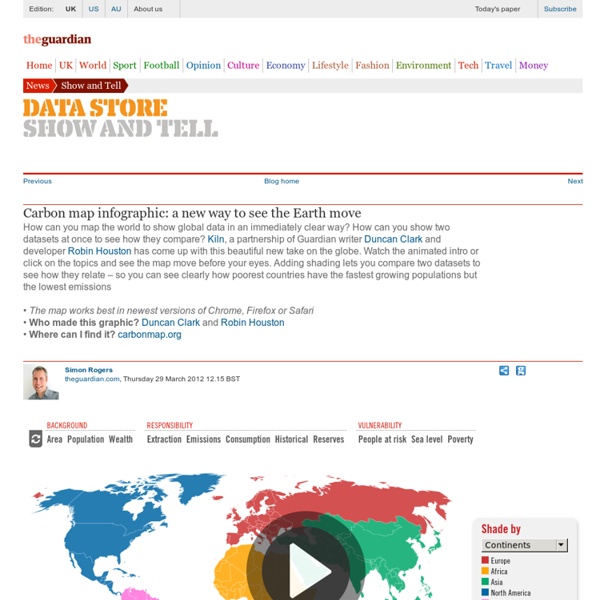
Olympic athletes Turn autoplay off Edition: <span><a href=" Sign in Beta About us Today's paper Subscribe Custom Search Olympic athletes: the 2012 Games full list visualised Who is competing in the 2012 Olympics - and where are they from? Powered by Tableau Sport Olympic Games 2012 UK news Series London 2012 Olympics data More from Datablog on Sport Olympic Games 2012 London 2012 Olympics data More blogposts More interactives Facts Are Sacred by Simon Rogers From the war in Afghanistan to the London riots, Facts Are Sacred is a full-colour collection of the most interesting findings from the Guardian datablog. Hot topics © 2014 Guardian News and Media Limited or its affiliated companies. Send to a friend Your IP address will be logged Share Short link for this page: Contact us Close
Websites need… Posted: February 21st, 2012 I created a successful mind map several years ago which I would show to clients in meetings to help them understand ‘SEO’ better. It was also shown at many search conferences all over the world, with entire seminars built around it. So, I came up with the following SEO data visualisation – an update to my previous work – which is an interactive way to show many facets required to create a successful website. Click text on the mind map to travel around and view information: Maybe some subject-matter experts in each discipline will think that there are omissions, but I have tried to keep it simple so that relative beginners, non-SEOs and non-techies can understand it – this is not the time and place to show everyone here that I am clever (the biggest mistake that 99% of SEOs make) – I just want to share and help people. And, just let me know if you like it or not James Welch
What Career Should I Choose? - Rasmussen College Annotations on off The color of the dots indicates expected growth or decline for each occupation in the selected categories by 2020: Growing 30% or more Growing 10% - 30% Growing 0 - 10% Declining Occupations in non-selected categories Hover over the dots for more information about each occupation. Love it? Close <a href=" target="_blank"><img src=" border="0" width="128" height="128" /></a><br /><span style="font-family:"Lucida Grande", Helvetica, Arial, Tahoma, sans-serif; font-size: 12px;">Click image to open interactive version (via <a href=" College</a>).
If the Moon Were Only 1 Pixel - A tediously accurate map of the solar system Mercury Venus Earth You Are Here Moon Mars Jupiter Io Europa Ganymede Callisto Saturn Titan Uranus Neptune Pluto(we still love you) That was about 10 million km (6,213,710 mi) just now. Pretty empty out here. Here comes our first planet... As it turns out, things are pretty far apart. We’ll be coming up on a new planet soon. Most of space is just space. Halfway home. Destination: Mars! It would take about seven months to travel this distance in a spaceship. Sit back and relax. When are we gonna be there? Seriously. This is where we might at least see some asteroids to wake us up. I spy, with my little eye... something black. If you were on a road trip, driving at 75mi/hr, it would have taken you over 500 years to get here from earth. All these distances are just averages, mind you. If you plan it right, you can actually move relatively quickly between planets. Pretty close to Jupiter now. Sorry. Lots of time to think out here... Pop the champagne! We're always trying to come up with metaphors for big numbers.