
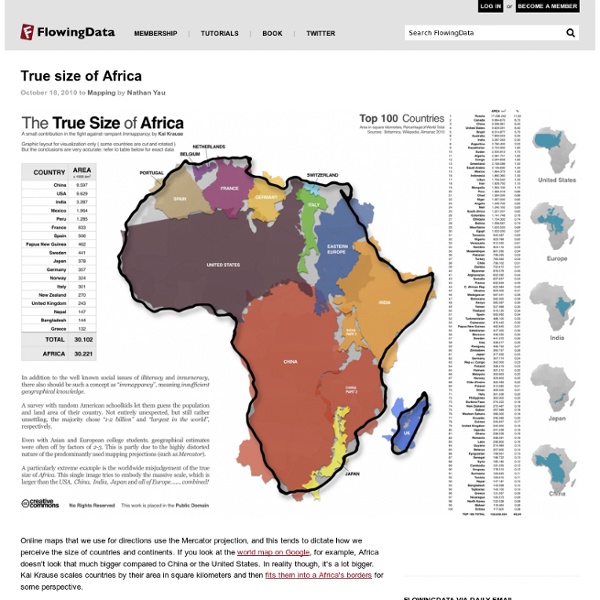
Cartography: The true true size of Africa LAST month Kai Krause, a computer-graphics guru, caused a stir with a map entitled "The True Size of Africa", which showed the outlines of other countries crammed into the outline of the African continent. His aim was to make "a small contribution in the fight against rampant Immappancy"—in particular, the fact that most people do not realise how much the ubiquitous Mercator projection distorts the relative sizes of countries. A sphere cannot be represented on a flat plane without distortion, which means all map projections distort in one way or another. Some projections show areas accurately but distort distances or scales, for example; others preserve the shapes of countries but misrepresent their areas. Gerardus Mercator's projection, published in 1569, was immediately useful because it depicts a line of constant bearing as a straight line, which is handy for marine navigation.
Africa Map - Clickable to Map of African Countries Africa is home to more than one billion people and the second largest continent in the world. Africa can lay claim to being the birthplace of civilization with ancient Egypt being the first literate society. Today, Africa is one of the world’s most diverse continents and is home to dozens of different countries and cultures. Geography of Africa Africa covers an area of 11,730,000 square miles. Africa features a number of well-known geographic features. The source of the Nile River is the Great Lakes region in central Africa. The highest mountain in Africa is Mount Kilimanjaro with a summit of 5,895 meters above sea level. Countries and Cultures of Africa Africa is made up of 64 different political territories. Christianity and Islam are the two dominant religions in Africa. History of Africa Africa is frequently referred to as the “cradle of civilization”. Africa is also the world’s oldest landmass. The people of the Kingdom were known as the Sabeans. Popular Attractions in Africa
Are the Richest Americans Also the Best Educated? More Infographics on Good 8 maps that will change the way you look at Africa You already know that Africa isn’t a country. But what else? Check out these maps and put the continent’s population, income, growth, and potential into context. 1. Where the world’s 7 billion live National Geographic‘s map illustrates where and how the world lives. 2. Using data from the World Bank Development Indicators, Global Finance‘s map shows us what the world will look like in 2015 – that is if it were inflated to the size of their economic wealth. 3. If you’re like most, you know the African continent is pretty big. 4. To quote Rajiv Narayan from Upworthy, “Sure 12 Years a Slave won an Oscar, but we all deserve to win Best Actor for pretending slavery doesn’t exist anymore.” The map above, issued by the Walk Free Foundation stains the world map with reds representing concentrated slavery presence and lighter yellows for lower concentrations. 5. This view of the world’s vegetation presented by NASA clearly depicts the pastoral difference between North and South Africa. 6. 7. 8.
Income inequality, as seen from space Last week, I wrote about how urban trees—or the lack thereof—can reveal income inequality. After writing that article, I was curious, could I actually see income inequality from space? It turned out to be easier than I expected. Below are satellite images from Google Earth that show two neighborhoods from a selection of cities around the world. In case it isn’t obvious, the first image is the less well-off neighborhood, the second the wealthier one. Rio de Janeiro Rocinha Zona Sul Oakland West Oakland Piedmont Houston Fourth Ward River Oaks Chicago Woodlawn Hyde Park Beijing Fengtai Chaoyang Boston metro area, Massachusetts Ball Square, Somerville West Cambridge Your examples Do you have other cities or neighborhoods in mind? Be sure to include the names of the cities and neighborhoods you’re highlighting and if you’d like me to mention your name. Your examples are now posted! Related posts: Urban trees reveal income inequality Income inequality in the Roman Empire Ghosts of geography
Sub-Saharan Africa: Environment, Politics, and Development The winds of changes are blowing across Sub-Saharan Africa, a diverse region of 47 countries stretching from the rolling savannas south of the Sahara desert to the coastal mountains and valleys of the Cape. In hundreds of cities and towns, prodemocracy demonstrators have taken to the streets. In over a dozen countries, opposition to one-party rule has led to promises of open elections, and major reforms aim at improving relations between governments and their citizens. Despite these changes, over 70 percent of the people in Sub-Saharan Africa still lack basic civil liberties and human rights. The forces of colonialism are partially responsible for Africa's difficulties today. When the colonial era ended in the 1950s and 1960s, Sub-Saharan countries were left with few trained personnel and little infrastructure. Living mainly in rural areas, many Africans now make a living through a combination of agriculture, domestic animal keeping, and wage labor. Sub-Saharan Africa Resources:
If the world’s population lived like… Shortly after I started Per Square Mile, I produced an infographic that showed how big a city would have to be to house the world’s 7 billion people. There was a wrinkle, though—the city’s limits changed drastically depending on which real city it was modeled after. If we all lived like New Yorkers, for example, 7 billion people could fit into Texas. Here’s that infographic one more time, in case you haven’t seen it: What’s missing from it is the land that it takes to support such a city. It turns out that question is maddeningly difficult to answer. But what we can do is compare different countries and how many resources their people—and their lifestyles—use. Sources: Global Footprint Network. 2011. Wackernagel, M., Kitzes, J., Moran, D., Goldfinger, S. & Thomas, M. (2006). Related posts: If the world’s population lived in one city… 7 billion Spare or share?
Vaccine-Preventable Outbreaks This interactive map visually plots global outbreaks of measles, mumps, whooping cough, polio, rubella, and other diseases that are easily preventable by inexpensive and effective vaccines. Red triangles indicate attacks on vaccinators and healthcare workers, as well as announcements from both governments and non-state actors that have had an impact—either positive or negative—on the successful implementation of vaccination programs. The Global Health Program at the Council on Foreign Relations has been tracking reports by news media, governments, and the global health community on these outbreaks since the fall of 2008. This project aims to promote awareness of a global health problem that is easily preventable, and examine the factors that threaten the success of eradicating preventable illnesses such as polio. Learn more about Global Health. On to the Vaccine-Preventable Outbreaks map
Electoral college reform (fifty states with equal population) – fake is the new real The electoral college is a time-honored, logical system for picking the chief executive of the United States. However, the American body politic has also grown accustomed to paying close attention to the popular vote. This is only rarely a problem, since the electoral college and the popular vote have only disagreed three times in 200 years. However, it's obvious that reforms are needed. The fundamental problem of the electoral college is that the states of the United States are too disparate in size and influence. The largest state is 66 times as populous as the smallest and has 18 times as many electoral votes. Poster A poster version of the map is for sale. The poster is $35 and ships first class to your door, safely packed in a sturdy tube. Consult the shop for more about shipping. Advantages of this proposal Preserves the historic structure and function of the Electoral College. Disadvantages Some county names are duplicated in new states. Methodology
Balloon Mapping From the Ground Up: Public Lab's Field Techniques Public Lab’s balloon- and kite-based mapping approach is a new way to take aerial images from the ground. However, there are some considerations and things that can be learned from a few map stories. Each map project has distinct characteristics in its time, place, and local atmospheric conditions. Lake Merritt (Oakland, Calif.) This map was created on a late July morning. In some cases, the balloon is lowered all the way back to the ground to get around or under things. UC Davis Campus (Davis, Calif.) This map was made on a foggy November morning in California’s Central Valley. After the first hour, the sun started to burn through, and we were able to fly at our goal altitude of 500 feet. Sunol Ag Park (Sunol, Calif.) While doing a scheduled flight at a community agricultural park, we encountered clear weather with high winds. Chandeleur Islands (Louisiana) Wind can sometimes enable better aerial imaging rather than deter it.