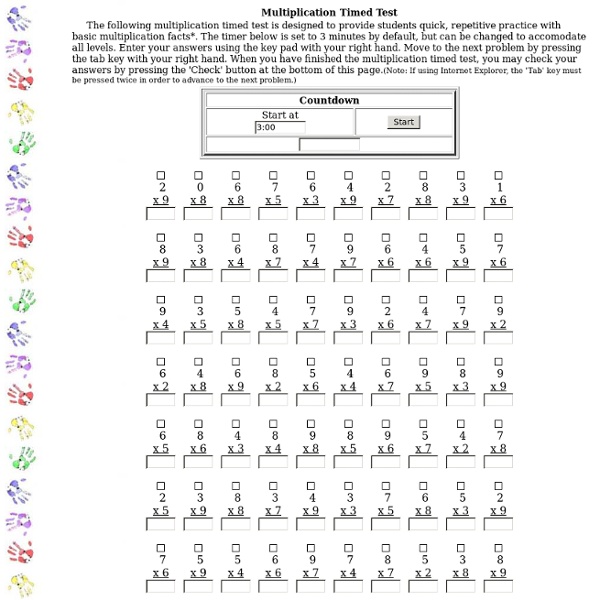


Math and Science For Children - Pre - K , Kindergarten to 7th Grades myth and legend book everyday 15 min How to teach … times tables Not knowing their multiplication tables can really slow children's mathematical progress once they get to secondary school. Everyone knows it's all about practice, and this can get tiresome. So how to drum these basic skills into your pupils' heads without turning them off? The Guardian Teacher Network has some great resources and ideas to help provide a solid times tables platform for students while at the same time helping teachers (and parents at home, where much of the practising must be done) to keep it fresh. One of the network's star resource providers, maths teacher Mel Muldowney, explains: "Students coming to secondary without knowing their times tables often think they can't do what they are learning in class. Thanks to key stage 1 teacher Des Hegarty for these mixed multiplication worksheets, comprising missing number sentences. Tony Watson has designed a 34-week intervention to help children master the times tables.
Angles - Acute, Obtuse, Straight and Right An angle measures the amount of turn Names of Angles As the Angle Increases, the Name Changes: Try It Yourself: Also: the letter "A" has an acute angle. Be Careful What You Measure Positive and Negative Angles When measuring from a line: a positive angle goes counterclockwise (opposite direction that clocks go) a negative angle goes clockwise Example: −67° Parts of an Angle The corner point of an angle is called the vertex And the two straight sides are called arms The angle is the amount of turn between each arm. How to Label Angles
How Do I Choose Which Type of Graph to Use?-NCES Kids' Zone How to Choose Which Type of Graph to Use? When to Use . . . . . . a Line graph. Line graphs are used to track changes over short and long periods of time. . . . a Pie Chart. Pie charts are best to use when you are trying to compare parts of a whole. . . . a Bar Graph. Bar graphs are used to compare things between different groups or to track changes over time. . . . an Area Graph. Area graphs are very similar to line graphs. . . . an X-Y Plot. X-Y plots are used to determine relationships between the two different things.
Data Handling Teaching Ideas Graphs: Graph - Animal Names - A graph, designed for use as a discussion exercise for Year 1, but with potential for use with all age groups. Contributed by Lynn Medland. Understanding Graphs - A visual (and extremely effective) way of helping children to understand line graphs. Bar Graphs - A PDF file, created by David Hatchett, intended to support work in Year 5 on bar graphs. Pictograms - A PDF, aimed at Year 3, asking children to interpret a given pictogram. Contributed by Kathryn Dennis. <A HREF=" Probability: The Sock Game - A simple activity which develops tallying, estimating, fractions and probability Even Steven - A simple game involving addition, halving and probability. Data Handling Resources:
Thesaurus.com | Find Synonyms and Antonyms of Words at Thesaurus.com