background preloader

Density Design

Density Design
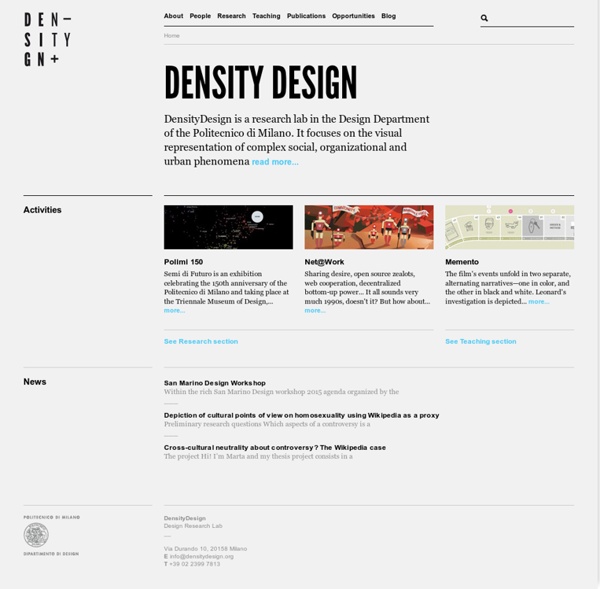
DensityDesign is a research lab in the Design Department of the Politecnico di Milano. It focuses on the visual representation of complex social, organizational and urban phenomena read more... Activities For the second time Greenpeace UK commissioned DensityDesign an infographic, this time for a report on McKinsey's Marginal Abatement Cost Curve... more... Italy is a high-risk country, are the Italians prepared? Are they feeling in danger?

http://www.densitydesign.org/

featured projects Quantified Other Five weeks of my father's Nike Fuel data Tatelets Generative bracelet based on artworks from Tate Modern Threads 10 Awesome Tools To Make Infographics Advertisement Who can resist a colourful, thoughtful venn diagram anyway? In terms of blogging success, infographics are far more likely to be shared than your average blog post. 40 Essential Tools and Resources to Visualize Data One of the most frequent questions I get is, "What software do you use to visualize data?" A lot of people are excited to play with their data, but don't know how to go about doing it or even start. Here are the tools I use or have used and resources that I own or found helpful for data visualization – starting with organizing the data, to graphs and charts, and lastly, animation and interaction. Organizing the Data by sleepy sparrow Data are hardly ever in the format that you need them to be in.

Diagramly – A Handy Tool For Creating Quick Flowcharts The best thing about Diagramly is how accessible it is. You just click a URL, and you’re in. There’s no download, no account registration, and you don’t even need Flash to use it. It really couldn’t be simpler to get started. The worst thing about Diagramly (I’ll just get this out of the way right now) is the utter lack of documentation. For example, check out this diagram I made for you, showing the ideal MakeUseOf reader’s workflow: infographics Infographics News, a somewhat new BlogSpot blog, has a short list from Ninian Carter of some great infographics of the last year. Ninian Carter is an scottish infographic journalist, well, the Phineas Fogg of the infographic journalists: he has worked in Scotland, England, France, Australia… and his last job was in Canada, at The Globe & Mail, place he left recently. So, as the A Team, he is avalaible for works… (if you click on his name, opening the post, you’ll go to his personal web). Once you get past the horrible spelling of the article (spell-check people, it’s a handy feature), it’s a nice collection of infographics. I’ll probably post some of these online throughout the day in full-size. via Infographics news: Best infographics of 2010 according to Ninian Carter.

How To Create Outstanding Modern Infographics In this tutorial you will learn that data doesn't have to be boring, it can be beautiful! Learn how to use various graph tools, illustration techniques and typography to make an accurate and inspiring infographic in Adobe Illustrator. Start by using the Rectangle Tool (M) to draw a shape. Showcases on Datavisualization Interactively Explore the YOLO Flip 12 Feb 2014 Showcases Animation, Interactive, Process, Sports In preparation of the Winter Olympic Games 2014 in Sochi, we helped the Swiss newspaper Neue Zürcher Zeitung publish a long-form article about Iouri Podladtchikov, a professional snowboarder and – since yesterday – freshly baked Olympic gold medalist. To help readers better understand the sport, we created a series of illustrations and an interactive animation. Read more

Download Choose your operating system: TheBrain 8 for Mac OS X Mac OS 10.7+1 GHz Intel Processor, 1GB RAM, 100 MB available storage TheBrain 8 for Linux Datasets on Datavisualization Wikileaks US Embassy Cables 29 Nov 2010 Datasets Infographic, Politics Wikileaks began on Sunday November 28th publishing 251,287 leaked United States embassy cables, the largest set of confidential documents ever to be released into the public domain. Here's how media outlets strive to make the data more accessible than its original form. Read more Teaching With Infographics Earlier this week I learned from Larry Ferlazzo that The New York Times Learning Network was doing a series of posts about teaching with infographics. The last installment of the series went live today with a post by Diana Laufenberg. Diana's post includes ten steps for designing lessons in which students create infographics. Her post also includes links to some valuable information concerning the actual infographic design process. The entire Teaching With Infographics series contains a lot of very useful information for teachers who are considering using infographics in their classrooms.

Working with Data in Protovis on Datavisualization Protovis is an open-source Javascript visualization library by the Stanford Visualization Group and has become one of the preferred tools in our arsenal. If you want to get started with the popular toolkit too, Jerome Cukier has a comprehensive tutorial about how to work with data in Protovis. The tutorial is split in five parts covering using (1, 2), sorting (3) and reshaping (4) arrays as well as how to structure data to work with complex structures like treemaps or force-directed layouts (5). For the past year or so I have been dabbling with protovis. Be aware that the content is laser focused on how to deal with data instead of shiny visualization goodness. That said, if you plan to create custom visualizations with Protovis, I highly recommend to have a look at Jerome’s notes.

Data Visualization: Modern Approaches - Smashing Magazine About The Author Vitaly Friedman loves beautiful content and doesn’t like to give in easily. When he is not writing or speaking at a conference, he’s most probably running … More about Vitaly Friedman … Data presentation can be beautiful, elegant and descriptive. There is a variety of conventional ways to visualize data - tables, histograms, pie charts and bar graphs are being used every day, in every project and on every possible occasion. However, to convey a message to your readers effectively, sometimes you need more than just a simple pie chart of your results.

Related: