Facebook for News Apps: How We Harnessed The Social Network for ‘The Opportunity Gap’
Our latest news application, The Opportunity Gap, integrates Facebook in a deeper way than we've ever done before. Last week we published The Opportunity Gap, a news application that lets readers find out how equally their state provides poor and wealthier schools access to advanced classes that researchers say will help students later in life. It features a host of technologies we’re using for the first time and that we anticipate will be part of many of our news apps in the future. These include a new JavaScript-based “workspace” approach to placing, sorting and removing multiple entities on a single page.
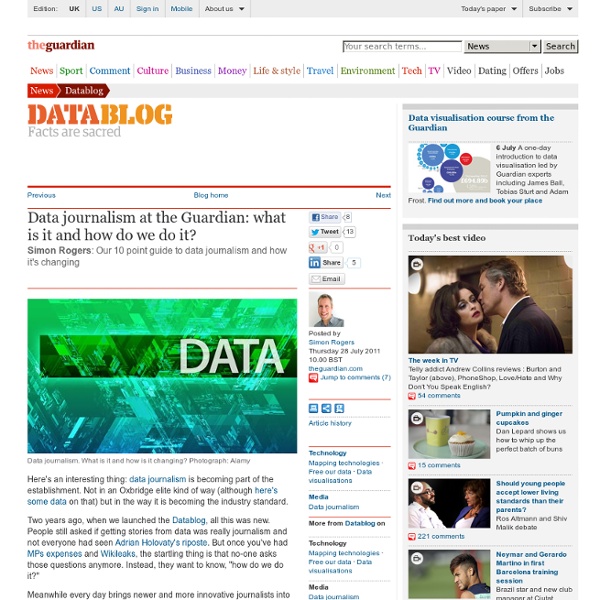
The inverted pyramid of data journalism
I’ve been working for some time on picking apart the many processes which make up what we call data journalism. Indeed, if you read the chapter on data journalism (blogged draft) in my Online Journalism Handbook, or seen me speak on the subject, you’ll have seen my previous diagram that tries to explain those processes. I’ve now revised that considerably, and what I’ve come up with bears some explanation. I’ve cheekily called it the inverted pyramid of data journalism, partly because it begins with a large amount of information which becomes increasingly focused as you drill down into it until you reach the point of communicating the results. What’s more, I’ve also sketched out a second diagram that breaks down how data journalism stories are communicated – an area which I think has so far not been very widely explored. But that’s for a future post.
Live map of London Underground trains
Loading... Powered by Leaflet — Map tiles © Thunderforest, data © OpenStreetMap contributors. Live London Underground map By Matthew Somerville.
ProPublica’s newest news app uses education data to get more social
ProPublica reporters used the Ed data to produce a story package, “The Opportunity Gap,” that analyzes the OCR info and other federal education data; their analysis found among other things that, overall and unsurprisingly, high-poverty schools are less likely than their wealthier counterparts to have students enrolled in those beneficial programs. The achievement gap, the data suggest, isn’t just about students’ educational attainment; it’s also about the educational opportunities provided to those students in the first place. And it’s individual states that are making the policy decisions that affect the quality of those opportunities. ProPublica’s analysis, says senior editor Eric Umansky, is aimed at answering one key question: “Are states giving their kids a fair shake?” ProPublica leads the field in developing news apps; each one demands a unique strategy for determining how users will actually navigate — and benefit from — the app’s interface.
When Data Tell Stories
Last April, the International Consortium of Investigative Journalists (ICIJ) revealed one of the greatest data leaks obtained and analysed to date by any media outlet. “Offshore Leaks” is a vast multimedia report that exposes the networks of businesses, politicians, fundraisers and celebrities from all over the world that use companies and trusts in offshore tax havens. Through the use of maps, videos and infographics, readers are able to understand the web of connections and their millionaire money transactions over the course of the years. However, to be able to present this macro-project that exposes the tax havens, the ICIJ had 86 journalists from 46 countries working for a year and a half, managing a total of 260 gigabytes of data. Network of contacts in the world of offshore tax havens. ICIJ used advanced tools such as Nuix to see how those involved were connected.
Data visualization books: How to start your personal library The Excel Charts Blog
There are many approaches to data visualization. Take well-know authors like Tufte, Cleveland, Ware, Few, Bertin or McCandless. There is some overlap, but they all approach data visualization from a different angle. That’s great news for you: this means that you can come up with a unique point of view that reflects your interests and needs. I suppose the books you buy are consistent with that view. Let me give you my own example.
7 ways to get your audience to participate in mobile mapping projects
News organizations are increasingly involving the community in their reporting and trying to figure out which approaches work well. One way to get your audience involved is to combine the ease of mobile texting with the visual appeal of a map. Throughout the past few years, I’ve launched several successful mobile mapping crowdsourcing projects for public radio stations and have found that they engaged audiences and helped advance news stories. Drawing on my experience with these projects, I’ve come up with some tips on how to involve your audience in a successful mobile mapping project in any medium. Start with a simple question.