
MyReadingMapped™ Tips, tricks and tools for data visualisation: plot your data with maps In my previous two articles I discussed the importance of ensuring that your data is clean and processed before attempting any form of data visualisation before going on to share some really awesome tools that you can use to create mind-blowing representations of the facts and figures. In this, the final article in the series, I talk about how maps and timelines can help take your data visualisation efforts to the next level. Maps can be used for a lot more than identifying latitude and longitude — they are also a great way to represent data. 1. Open Heat Map eases the process in that it simply takes a spreadsheet and overlays it with the mathematics and heat map tile rendering for you. 2. Color Brewer eases your pain in that it allows you to set parameters specific to your project where you can then choose from a series of pre-selected colour palettes that meet the criteria. Timelines A great way to visualise event data is by using a timeline. 1. 2. 3.
Tour Builder Important: As of July 2021, Google Tour Builder is no longer available. On July 15, 2021, Tour Builder was shut down and the following associated data will be deleted: Links to tours that you created or were shared with you Publicly available tours Information in the Tour Builder Gallery If you want to create new 3D maps and stories about places that matter to you, use the expanded functionality of Google Earth’s creation tools. With Google Drive, you can collaborate with others on any projects you create in Google Earth. About Tour Builder When Tour Builder launched in 2013, Google wanted to share a web-based tool that made it easy to add and share photos and videos to a sequence of locations on Earth. With Projects, you can turn our digital globe into your own storytelling canvas and collaborate with others through Google Drive. Learn about Google Earth & Google Earth Pro You can learn more with the Google Earth help center articles and frequently asked questions.
NatGeo Mapmaker Interactive Customize the map and save it to make it your own with bookmarks, drawings, labels, and more. To save your map, you will need to enter your email address and the system will send you a set of links to use to edit and share your map. Cinco herramientas sorprendentes para crear mapas históricos geolocalizados - aulaPlaneta Los mapas siempre han sido una herramienta fundamental en el estudio de la Historia. Gracias a ellos, los alumnos han podido situar geográficamente las batallas, la evolución de las fronteras o los viajes y rutas que han cambiado la historia. Como en otras materias, las TIC han revolucionado la manera de consultar y elaborar estos mapas, accesibles ahora desde cualquier lugar. Te recomendamos cinco herramientas sorprendentes para que tus alumnos aprendan a crear y puedan consultar mapas históricos geolocalizados. Situar acontecimientos, incluir información, completar mapas a base de fotos de otras épocas… estas son algunas de las posibilidades que ofrecen estas nuevas herramientas para crear mapas históricos interactivos: 1. Puedes incluir estos y otros recursos que consideres interesantes en tu Cuaderno del Profesor y en los Cuadernos de Estudio digitales de aulaPlaneta, para que tus alumnos los utilicen en clase. ¿Qué te parecen estos recursos?
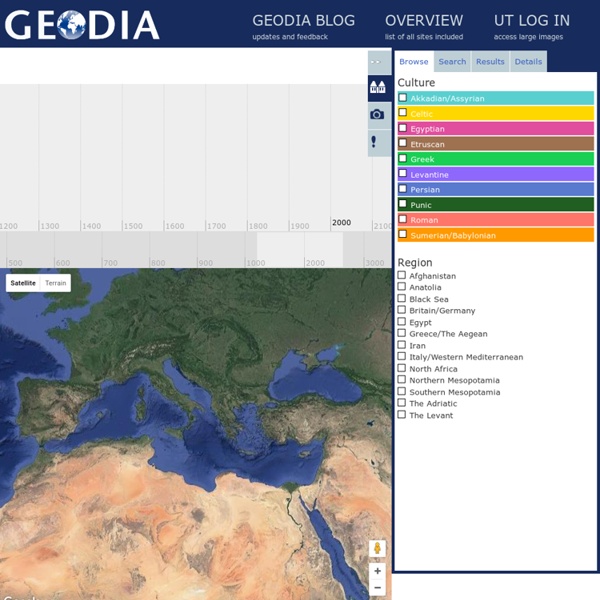
Herramienta de enseñanza y aprendizaje para todos los interesados en la cultura material del antiguo mundo mediterráneo by waltherbeltranardila Jul 24