background preloader

INFOGRAPHIC: Where the world’s poorest will live in 2015

INFOGRAPHIC: Where the world’s poorest will live in 2015
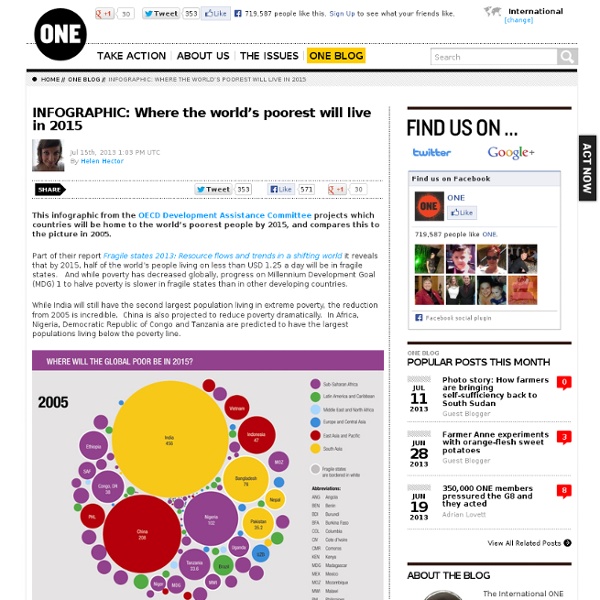
This infographic from the OECD Development Assistance Committee projects which countries will be home to the world’s poorest people by 2015, and compares this to the picture in 2005. Part of their report Fragile states 2013: Resource flows and trends in a shifting world it reveals that by 2015, half of the world’s people living on less than USD 1.25 a day will be in fragile states. And while poverty has decreased globally, progress on Millennium Development Goal (MDG) 1 to halve poverty is slower in fragile states than in other developing countries. While India will still have the second largest population living in extreme poverty, the reduction from 2005 is incredible.

World debt comparison: The global debt clock China, technology and the U.S. middle class President Barack Obama’s State of the Union speech this week confirmed it: The pre-eminent political and economic challenge in the industrialized democracies is how to make capitalism work for the middle class. There is nothing mysterious about that. The most important fact about the United States in this century is that middle-class incomes are stagnating. The financial crisis has revealed an equally stark structural problem in much of Europe. Even in a relatively prosperous age — for all of today’s woes, we have left behind the dark, satanic mills and workhouses of the 19th century — this decline of the middle class is more than an economic issue. It is also a political one. All of which is why understanding what is happening to the middle class is urgently important. But when I asked him this week what had gone wrong for the U.S. middle class, he gave a different answer: “The main problem is we’ve just had a decade of incredibly anemic employment growth. “U.S.

Global Wealth Distribution As we have discussed, from 1979 to 2007, inflation-adjusted incomes of the top 1 percent of households increased significantly versus the rest of the wage earners (i.e., the remaining 99%). Those even better off, the top 0.1 percent (the top one one-thousandth of households), saw their incomes grow 390%. In contrast, incomes for the bottom 90 percent grew just 5 percent between 1979 and 2007. All of that income growth, however, occurred in the unusually strong growth period from 1997 to 2000, which was followed by a fall in income from 2000 to 2007. Is this wealth concentration a global phenomena, or is it a US centric? Lets go to the global data, via Credit Suisse Research Institute’s Global Wealth Databook: Source: Credit Suisse, Research Institute And as a reminder, here is the recent growth in the US data, via EPI: Source: Economic Policy Institute UPDATE: November 1 2011 12:51pm David Wilson of Bloomberg News points out that a rising Misery Indexes worsens the income-gap effect:

The Hidden Prosperity of the Poor A concept promulgated by the right — the notion of the hidden prosperity of the poor — underpins the conservative take on the ongoing debate over rising inequality. The political right uses this concept to undermine the argument made by liberals that the increasingly unequal distribution of income poses a danger to the social fabric as well as to the American economy. President Obama forcefully articulated the case from the left in an address on Dec. 6, 2011 at Osawatomie High School in Kansas: This kind of gaping inequality gives lie to the promise that’s at the very heart of America: that this is a place where you can make it if you try. We tell people — we tell our kids — that in this country, even if you’re born with nothing, work hard and you can get into the middle class. We tell them that your children will have a chance to do even better than you do. echo a standard left-wing critique of capitalism: Economic growth does not serve all classes of society. Economic Policy Institute

We’re More Unequal Than You Think by Andrew Hacker The Spirit Level: Why Greater Equality Makes Societies Stronger by Richard Wilkinson and Kate Pickett Bloomsbury, 331 pp., $28.00; $18.00 (paper) The Darwin Economy: Liberty, Competition, and the Common Good by Robert H. Frank Princeton University Press, 240 pp., $26.95 The Age of Austerity: How Scarcity Will Remake American Politics by Thomas Byrne Edsall Doubleday, 272 pp., $24.95 Why Some Politicians Are More Dangerous Than Others by James Gilligan Polity, 229 pp., $19.95 Imagine a giant vacuum cleaner looming over America’s economy, drawing dollars from its bottom to its upper tiers. All four of the books under review reject Hamilton and Madison’s premises. The Spirit Level is a prodigious empirical effort directed to a moral purpose. As income gaps grow, they write, it’s not only the poor who suffer. The authors don’t go so far as to say that people with above-average incomes would end up better off were they to take home less money, and if greater numbers of their poor compatriots had more.

The Price of Inequality - Video and audio - News and media Speaker(s): Professor Joseph E Stiglitz Chair: Professor Stephen P. Jenkins Recorded on 29 June 2012 in Old Theatre, Old Building. In his new book, The Price of Inequality, which he will discuss in this lecture Joseph Stiglitz considers the causes of inequality, why is it growing so rapidly and what are its economic impacts? He explains that markets are neither efficient nor stable and will tend to accumulate money in the hands of the few rather than engender competition and considers our political system that frequently shapes markets in ways that advantage the richest over the rest. Joseph Stiglitz was Chief Economist at the World Bank until January 2000. Professor Stiglitz will also be in discussion with Professor Amartya Sen on Thursday 28 June at 6.30pm. Event posting

POVERTY, CORRUPTION AND THE CHANGING WORLD, 1950-2050 Robert H. Wade On May 29 2013 James Wolfensohn, president of the World Bank from 1995 to 2005, gave the Amartya Sen lecture at the London School of Economics, on the subject, “Reflections on a changing world, 1950-2050”. His reflections on the changing world were mainly reflections on what he achieved as World Bank president. Here I comment on the first two: poverty reduction as the central goal of development, and corruption as an explicitly stated problem. Poverty reduction and inequality Wolfensohn’s elevation of poverty reduction as the central goal echoes then World Bank president Robert McNamara in 1973, forty years ago, who solemnly proposed in a speech in Nairobi, Kenya, a “new strategy”. But McNamara showed awareness of a closely related issue that remained eclipsed in the Wolfensohn era: income and related inequalities. Why this asymmetry of attention? Corruption On corruption, I begin with my own engagement with the Bank. Fast forward to Wolfensohn on 29 May. ShareThis

The World Factbook - GINI Coefficient The Office of Public Affairs (OPA) is the single point of contact for all inquiries about the Central Intelligence Agency (CIA). We read every letter, fax, or e-mail we receive, and we will convey your comments to CIA officials outside OPA as appropriate. However, with limited staff and resources, we simply cannot respond to all who write to us. Contact Information Submit questions or comments online By postal mail: Central Intelligence Agency Office of Public Affairs Washington, D.C. 20505 Contact the Office of Privacy and Civil Liberties Contact the Office of Inspector General Contact the Employment Verification Office Before contacting us: Please check our site map, search feature, or our site navigation on the left to locate the information you seek.

World Economic Outlook 2012 -- IMF Lately, the near-term outlook has noticeably deteriorated, as evidenced by worsening high-frequency indicators in the last quarter of 2011 (Figure 2: CSV|PDF). The main reason is the escalating euro area crisis, which is interacting with financial fragilities elsewhere (Figure 3: CSV|PDF). Specifically, concerns about banking sector losses and fiscal sustainability widened sovereign spreads for many euro area countries, which reached highs not seen since the launch of the Economic and Monetary Union. The updated WEO projections see global activity decelerating but not collapsing. Overall, activity in the advanced economies is now projected to expand by 1½ percent on average during 2012–13. • The euro area economy is now expected to go into a mild recession in 2012—consistent with what was presented as a downside scenario in the January 2011 WEO Update. Commodity prices generally declined in 2011, in response to weaker global demand. Downside risks stem from several sources.

IMF -- International Monetary Fund Home Page How the Government Measures Unemployment How the Government Measures Unemployment (PDF) Why does the Government collect statistics on the unemployed? When workers are unemployed, they, their families, and the country as a whole lose. Workers and their families lose wages, and the country loses the goods or services that could have been produced. In addition, the purchasing power of these workers is lost, which can lead to unemployment for yet other workers. To know about unemployment—the extent and nature of the problem—requires information. Where do the statistics come from? Early each month, the Bureau of Labor Statistics (BLS) of the U.S. Some people think that to get these figures on unemployment, the Government uses the number of persons filing claims for unemployment insurance (UI) benefits under State or Federal Government programs. Other people think that the Government counts every unemployed person each month. There are about 60,000 households in the sample for this survey. People with jobs are employed.

Related: