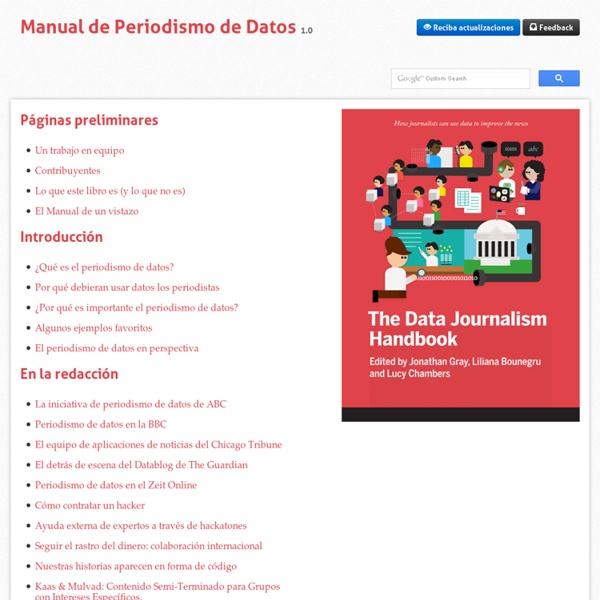


Manual de Periodismo de Datos Iberoamericano ¿Cómo y por qué surgio la idea de hacer el Manual? Este proyecto nace como idea, inspirado en el Data Journalism Handbook, a partir de múltiples conversaciones con periodistas de toda la región y del diagnóstico realizado en un taller de lluvia de ideas en la MediaParty de Hacks/Hackers en Buenos Aires en octubre de 2012, de la necesidad de contar con un compendio de información y herramientas para el Periodismo de Datos, enfocado a la situación de nuestros países, ya que vivimos, investigamos y hacemos periodismo en contextos muy diferentes a los de Estados Unidos o Inglaterra. En todos estos casos nos situamos desde la carencia de herramientas y técnicas para acelerar y fomentar un mejor periodismo y reportería online y offline para nuestras comunidades. Este proyecto pretende hacerse cargo de estas falencias y detallar el estado de situación del Periodismo de Datos en Iberoamérica, cumpliendo la función de ser también un mapa de lo que pasa en nuestros países. Y reportes por país sobre:
OKFN Spain La nueva revolución de la información: el periodismo de datos - lanacion.com Vivimos en un mundo en el que los productores de contenidos se multiplican en varias áreas del conocimiento; por eso, diferentes actores están repensando su rol y aportando un diferencial en el proceso de generar información. Al mismo tiempo, los ciudadanos son cada vez más exigentes sobre la calidad de los contenidos que reciben, demandan más transparencia y diálogo. La tecnología y las herramientas gratuitas de Google, tales como Fusion Tables o Google Refine, permiten procesar grandes volúmenes de datos y presentarlos de manera más atractiva para su mejor interpretación, pero también hacen posible aumentar la interacción entre el equipo productor de noticias y cada ciudadano que forma parte de la audiencia. Se están produciendo cambios importantes. "Desde este punto de vista, la creencia de que la tecnología desplaza al periodista está lejos de la realidad. Y añadió: "La misión de Google es organizar la información del mundo y hacerla útil y accesible para todo el mundo.
CiComunica 40 maps that explain the world By Max Fisher By Max Fisher August 12, 2013 Maps can be a remarkably powerful tool for understanding the world and how it works, but they show only what you ask them to. So when we saw a post sweeping the Web titled "40 maps they didn't teach you in school," one of which happens to be a WorldViews original, I thought we might be able to contribute our own collection. Some of these are pretty nerdy, but I think they're no less fascinating and easily understandable. [Additional read: How Ukraine became Ukraine and 40 more maps that explain the world] Click to enlarge. Anuari Mèdia.cat | Els silencis mediàtics de 2011 Anuari Mèdia.cat XAVIER ALEGRET La infanta Pilar de Borbó, germana del rei Joan Carles I, té un patrimoni de 4,5 milions en una SICAV que pràcticament no paga impostos LAIA BALASCH Una sentència afirma que no hi ha contracte de concessió que reguli la relació entre l’Ajuntament de Barcelona i l’empresa que subministra l’aigua a la capital catalana MONTSE SANTOLINO / JORDI DE MIGUEL L’ONG Veterinaris Sense Fronteres denuncia l’entitat d’estalvis per col.laborar en l’encariment mundial de productes de primera necessitat a través d’un dipòsit financer de risc ROGER TUGAS La nova canonada que ha d’unir Martorell i Figueres per transportar gas natural a l’Europa central té un futur incert pels dubtes del govern francès sobre el projecte MARIA MANYOSA MASIP El 71% de l’evasió tributària, que es calcula en uns 16.000 milions d’euros, es produeix entre les grans fortunes i corporacions empresarials
Big Data Imagine standing at an intersection. Every time the lights change, you count and record the number of cars that drive through. Over a day, you collect some basic data. Over a week, your data gets more useful and over a month, it becomes a potential resource for discovering ways to make the intersection more efficient. It’s this idea, collecting data on a huge scale and analyzing them, that may help us see new opportunities to solve big problems. Let’s say that instead of you recording cars at one intersection, we put sensors at every intersection in the U.S. and they all report data. Hidden in this big pile of growing data are important clues that could help commuters save time. That’s the goal of big data – turning all these data into useful information. Big Data is really huge and complex data. Second, we have to handle lots of incoming traffic data, which may come from multiple sources and in different formats.