
English 50 Exercises for Story Writers English 50 – Intro to Creative Writing: Exercises for Story Writers Basic Theory: What is a short story? As soon as someone delivers a definition, some good writer will write a story that proves the theory wrong. Short stories have a narrator; that is, someone tells the story; have at least one character in them; have some action occur (or perhaps fails to occur); take place somewhere; that is, there is a setting for the action; and someone either learns something or fails to learn something (theme).With these five characteristics in mind, we can create an almost endless supply of exercises to help sharpen our techniques of story telling. Narrative Voice Twenty or so years ago, voice was the "rite of passage" into a successful writing career. Nevertheless, a narrative voice that sounds like it could be anyone's voice or is bland and boring, or riddled with pointless clichés will fail to capture and hold the reader's attention. If you've written a story in third person, try it in first.
Information Design – isabelmeirelles.com Course description:The course introduces basic concepts, methods and procedures of information design with focus on mapping information. It investigates visual systems and information structures such as maps, relational graphs, timelines and diagrams. Emphasis is placed on the exploration of conceptual and visual solutions, and on the creative process of organizing, visualizing and communicating information. Learning Objectives:• To develop basic critical language and procedures used in information design; • To learn how to analyze, organize, visualize and communicate information; • To explore methods of research, design and testing in the field of information design; • To explore how to communicate complex information to a specific audience. ASSIGNMENTS: For description and student work prior to 2009 please visit previous archive, which requires Flash player. Assignment #1 :Task: The assignment consists of weekly diagrams communicating facts. Laura Upham, 2010 Veronica Zhu, 2010
Mapping Customer Experience Excellence - In by Arne van Oosterom When the nice people at MyCustomer.com asked me to write an article about customer journey mapping, I knew right where to begin. A product or service is merely a means to an end. Unfortunately, most organizations are not capable of listening to stories. People-centered approaches like Design Thinking, Social Design and Service Design have emerged because it provides us with useful methods and tools to bridge the gap. I like the description given to it in an article by Kable: "CJM maps the route people take as they interact with services, taking quantitative measures such as number of contacts made and the time taken to access a service. Change Causes Friction Thinking in journeys can be very helpful. Only those who are adaptable survive. And it's exactly in this area where the biggest business opportunities lie. Customer journey mapping builds a mirror and enables us to question why we do the things we do. Building a Culture of Trust Context or stakeholder map.
Write or Die by Dr Wicked | Putting the 'Prod' in Productivity Flowing Data Tutorials How to Make a State Grid Map in R Something of a cross between a reference table and a map, the state grid provides equal space to each state and a semblance of the country to quickly pick out individual states. How to Make Animated Line Charts in R Sometimes it's useful to animate the multiple lines instead of showing them all at once. How to Make a Multi-line Step Chart in R For the times your data represents immediate changes in value. Symbols-based Charts to Show Counts in R Add visual weight by using individual items to show counts. Introducing a Course for Mapping in R Mapping geographic data in R can be tricky, because there are so many ways to complete separate tasks. How to Edit R Charts in Adobe Illustrator A detailed guide for R users who want to polish their charts in the popular graphic design app for readability and aesthetics. How to Make an Animated Map in R, Part 4 In the the last part of the four-part series, you make a longer animation with more data and annotate.
projects | zachary jean paradis MindshareViz / Imagined in Fall of 2005, for marketers, product developers and venture capitalists who are dissatisfied with traditional trend forecasting and market research reports, MindshareViz is a real-time trend visualization tool that reveals consumer intent through online search behavior. *Update* Google ended up building a remarkably similar tool to MindshareViz called Google Trends. It uses some of the features highlighted in MindshareViz in limited ways yet focuses mainly on a stock market like view. Check it out: Google Trends. FREE Rhyming Dictionary: Find Rhyming Words in Seconds
25 life-saving tips for Processing | Amnon P5 - Experiments with Processing by Amnon Owed 25 life-saving tips for Processing Posted by Amnon on January 28, 2012 · 37 Comments Well, perhaps they won’t literally save your life. But they surely will help you write your sketches easier, faster and more efficiently! This post will be covering tips, tricks and other need-to-know information about Processing. I’ve also included many runnable code examples. 1. frameCount, millis(), modulo % and noise Let me start with a few functions that in themselves and in combination are extremely useful. 2. math, logical and relational operator shortcuts Any program will use operators. 3. math with ints A very common mistake is doing math operations on integers and expecting a floating number outcome. 4. frameRate Processing’s frameRate is by default capped at 60 fps. 5. loading specific files from an external input directory Many applications use file input, for example an image or a data file. 9. combining 2D and 3D drawing What if you want a 2D background behind a 3D sketch? Final note!
European Centre for the Experience Economy Poem Starters and Creative Writing Ideas Enter your e-mail to get the e-book for FREE. We'll also keep you informed about interesting website news. "I have searched the web and used different worksheets, but none have come close to your worksheets and descriptions of (what to do and what not to do). Both courses I have taken have with Creative Writing Now have been amazing. Each time I have learned something new. "As usual - I already love the course on Irresistible Fiction, rewriting a lot and improving greatly even after the first lesson. “Essentials of Fiction proved that I could indeed write and I wrote every day, much to my boyfriend's dismay (waa sniff).” - Jill Gardner "I am loving the course and the peer interaction on the blog is fantastic!!!" "I'm enjoying the weekly email course, Essentials of Poetry Writing. "Thank you for all the material in this course. "I was pleasantly surprised at the quality of the lessons and feel they were very helpful in introducing new ideas and perspectives to my writing.
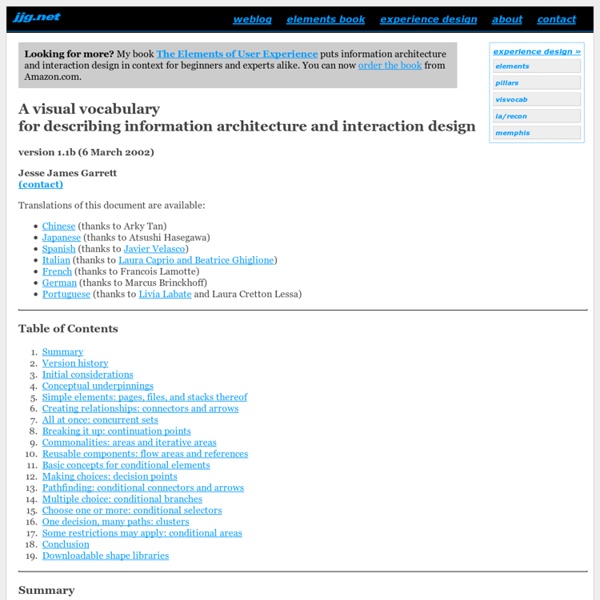
Data-driven journalism Data-driven journalism, often shortened to "ddj", is a term in use since 2009/2010, to describe a journalistic process based on analyzing and filtering large data sets for the purpose of creating a news story. Main drivers for this process are newly available resources such as "open source" software and "open data". This approach to journalism builds on older practices, most notably on CAR (acronym for "computer-assisted reporting") a label used mainly in the US for decades. Data-driven journalism has an even wider approach. As projects like the MP Expense Scandal (2009) and the 2013 release of the "Offshore leaks" demonstrate, data-driven journalism can assume an investigative role, dealing with "not-so open" aka secret data on occasion. Definitions[edit] The data-driven journalism process. In 2013, Van Ess came with a shorter definition in [5] that doesn't involve visualisation per se: Reporting based on data[edit] Telling stories based on the data is the primary goal. Data quality[edit]
The greatest inventions of all time Necessity is the mother of invention. But no one has ever asked – “what would be the father?” We’d argue that it’s imagination. Our respondents voted for everything from penicillin to bicycles to ‘0’, choosing inventions as humble as the pencil and as earth-shaking as the concept of democracy. It’s that kernel of ingenuity we wanted to celebrate with this question – asking people what they believe is the greatest invention of all time is a way to celebrate entrepreneurship, genius, creativity – the best of the human mind. “We always stand on the shoulders of giants, and no invention, however ingenious, is de-linked to what came before” Though some of the votes were for ‘discoveries’ rather than ‘inventions’, we’ve included them as best we could, in order to permit respondents to pay homage to people’s ingenuity in channelling existing phenomena into ideas which improved quality of life. As for the number one? Some inventions were conspicuous by their absence – where is the astrolabe?
creative writing prompts . com ideas for writers