background preloader

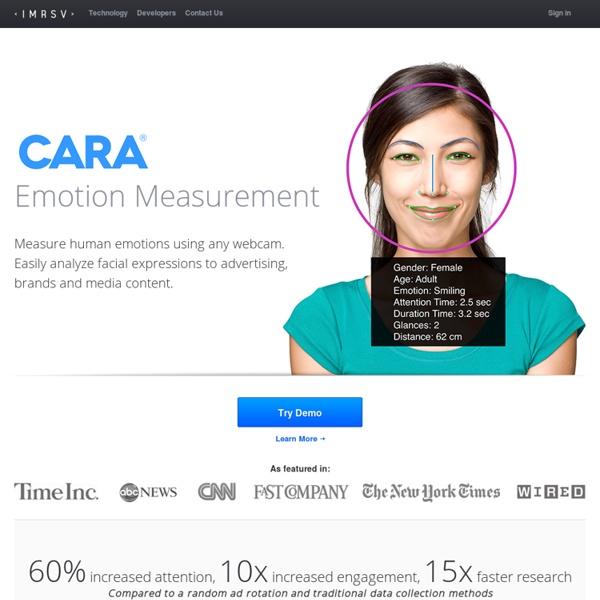
Immersive Labs - Smart Face Detection Software - Immersive Labs

Immersive Labs - Smart Face Detection Software - Immersive Labs

Excel Templates, Calendars, Calculators and Spreadsheets by Vertex42 5 Tools to Improve Your Idea Before You Write a Line of Code In my last post on ReadWriteStart, I talked about how, in many cases, it wasn't an advantage to build your start-up in stealth mode. As a continuation of that theme, I thought it would be interesting to explore five tools you can use to iterate and improve your startup idea before writing one line of code. There is nothing worse than building a tool no one is interested in, so I'd encourage you to consider these options before starting down the path of building your next startup. Specifically, these five tools can help you do three critical activities before starting to write a line of code: create a wireframe, get feedback from the target market and test value proposition through multiple landing pages. iMockups for Wireframing Concepts If a picture is worth 1,000 words, then a good mockup is worth 1,000 lines of code. Feedback on Concept from Target Market Once you've got a concept put together, it's often valuable to get some early feedback from your target market. Conclusion

My QR code experiment: 9 brands at the Mall of America on Black Friday | I’ve long been skeptical of the QR code madness among marketers. Sure, I’ve read all sorts of numbers around QR code adoption–good and bad. But many of the studies still pin *understanding* (not adoption) of QR codes in the 30 percent range. So, I tend to think, as a rule, QR codes are pretty over-hyped among marketers. Follow my logic for a moment. I might argue that’s an awfully damn tall order to get a customer to do steps 1-4 as outlined above. And that thinking is partially what drove my little experiment on Black Friday at the Mall of America. You see, we’ve seen a number of examples of brands using the codes in their marketing efforts–so we know what the brands are thinking/hoping to achieve. So, I took a page out of Tom Webster’s book and did my own work–a lesson he extolled at BlogWorld LA a few weeks ago. My goal was simple: To look at the user experience side of QR codes on the biggest shopping day of the year (Black Friday) at the biggest mall in the U.S. Let’s get to it. Macys

Most Awesome Daily Updates Interactive Experiments Focused on HTML5 Définition QR code - QR code, flashcode, datamatrix, microsoft tag et tous les codes barres 2D Vous découvrez pour la première fois la technologie QR code ? Voici une vidéo d'explication, très simple et pédagogique (niveau super débutant) pour télecharger votre premier lecteur et scanner votre premier QR code : Pour en savoir un peu plus, voici une présentation très simple et complète pour comprendre à quoi servent ces codes barres et pour quels usages. Pour tout savoir, voici une définition exhaustive de cette technologie. Le QR Code est un code-barre à deux dimensions (code 2D ou code matriciel) pouvant stocker jusqu'à 7 089 caractères numériques, 4 296 caractères alphanumériques ou 2 953 octets là où le code-barre "traditionnel" (code 1D) ne peut stocker qu'une vingtaine de caractères. Cette grande capacité de stockage est liée au fait que les informations sont contenues dans une "matrice" à 2 dimensions : Il a l'avantage de pouvoir stocker beaucoup d'informations tout en étant petit et rapide à scanner. Le QR code a été inventé au Japon en 19941 par la société Denso Wave2. etc..

10 Awesome Free Tools To Make Infographics Advertisement Who can resist a colourful, thoughtful venn diagram anyway? In terms of blogging success, infographics are far more likely to be shared than your average blog post. This means more eyeballs on your important information, more people rallying for your cause, more backlinks and more visits to your blog. In short, a quality infographic done well could be what your blog needs right now. Designing An Infographic Some great tips for designing infographics: Keep it simple! Ideas for infographic formats include: Timelines;Flow charts;Annotated maps;Graphs;Venn diagrams;Size comparisons;Showing familiar objects or similar size or value. Here are some great tutorials on infographic creation: Creating Your Infographic Plan and research.If required, use free software to create simple graphs and visualisations of data.Use vector graphic software to bring these visualisations into the one graphic. Free Online Tools For Creating Infographics Stat Planet Hohli Creately New York Times Many Eyes Wordle

REST API - Evri Table of Contents 1 Introduction 2 Registration and API Use Limits 2 URIs and Response Types 3 Versioning 4 Resources 5 Core Concepts 6 Example Scenarios 7 Code Samples 8 Feedback and Troubleshooting 9 Known Issues Introduction The Evri API gives you programmatic access to Evri’s rich mapping of the entity web, or the web of people, places and things connected to one another via language itself. Entities located in an article or body of text Popular entities on the entity web broken down by various categories like politician , actor or film . Structured information about an entity including things like birth date , death date , universities attended , children , etc. How entities are related including the news, blog, or web language that links them on the entity web How entities or combinations of entities are related to documents, images and video found on the web Media recommendations for entities, or combinations of entities, based on a specific news, blog, or web article mention. Versioning Resources

The 'intelligent' advert: Scanners to determine gender before sending messages according to sex By David Baker Updated: 13:50 GMT, 21 February 2012 A street advert which uses facial-recognition technology to tell men from women is to be used for the first time. The electronic hoarding, to be unveiled on a bus stop in London’s Oxford Street this week, plays a 40-second advertisement – with a different message depending on the gender of who is looking at it. Only women will be able to view the full message, which is for a charity promoting female education worldwide. Intelligent ad: A unique new advert which deciphers your gender before relaying a message accordingly has been put up at this bus stop in Oxford Street, London The advert echoes 2002 Tom Cruise thriller Minority Report, in which billboards directly targeted individuals. According to the Independent on Sunday it will guess their gender based on the distance between their eyes, the width of their nose and the shape of their jawline. The campaign highlights that at least 75 million girls around the world are not in school.

20+ Tools to Create Your Own Infographics A picture is worth a thousand words – based on this, infographics would carry hundreds of thousands of words, yet if you let a reader choose between a full-length 1000-word article and an infographic that needs a few scroll-downs, they’d probably prefer absorbing information straight from the infographic. What’s not to like? Colored charts and illustrations deliver connections better than tables and figures and as users spend time looking back and forth the full infographic, they stay on the site longer. Plus, readers who like what they see are more likely to share visual guides more than articles. While not everyone can make infographics from scratch, there are tools available on the Web that will help you create your very own infographics. In this article, we’re listing more than 20 such options to help you get your messages across to your readers, visually. Read Also: The Infographic Revolution: Where Do We Go From Here? What About Me? “What About Me?” Vizualize.me Piktochart easel.ly

Tokyo’s intelligent digital billboards can tell gender, age of passersby Tokyo is currently testing digital advertising billboards that use cameras to understand the gender and age group of passersby who look at them. Every time a new technology is announced, it's tempting to make a reference to the 2002 science fiction film Minority Report. This time it's for real. Tokyo, Japan's Digital Signage Promotion Project is currently trying out digital advertising billboards fitted with cameras that can discern the gender and age group of passersby who look at them. The point? A consortium of 11 railway companies launched the pilot project last month, and has since set up 27 intelligent displays in subway commuter stations around Tokyo. In JR Shinjuku station, straphangers are informed about two 52-inch smart billboards by a panel that reads, "Advertising survey under way; images being recorded to determine gender and age groups." As you might expect, the billboards' operators promise that they will not save recorded images. To compare, here's the scene from the film:

Blog About Infographics and Data Visualization - Cool Infographics

Related: