
mapamundi redes sociales Rosetta Stone for Unix Footnotes 1. In System V-based Unixes, run level relates to booting, shutdown, and single-user mode. 2. 3. 4. ioscan -funC disk may be helpful here to determine device path. 5. Universal Command Guide is a large book which covers several of the OSs in this table. UnixGuide.net has a similar table covering fewer Unix versions and a somewhat different set of tasks. Colin Barschel's Unix Toolbox cb.vu/unixtoolbox.xhtml is a wonderfully detailed handbook sorted by task area and giving both commands and config file excerpts for Linux and BSD. coolcommands is a search engine giving one-line command examples: www.coolcommands.com/index.php? Solaris / HP-UX / FreeBSD / Linux / AIX: www.unixporting.com/quickguide.html Solaris / HP-UX: soldc.sun.com/migration/hpux/migissues/. AIX / Linux: rick.jasperfamily.org/linux/quickstart.html AIX 4.3.3 / Solaris 8: www.redbooks.ibm.com/redpapers/pdfs/redp0104.pdfAIX 5.1.0 / Solaris 8: www.ibm.com/servers/aix/products/aixos/whitepapers/aixmapping.html
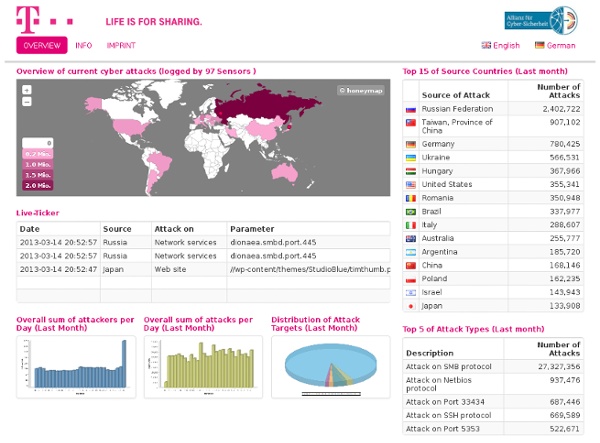
HoneyMap Email Marketing and Email List Manager | MailChimp IT Security News and Security Product Reviews The good, bad and ugly November 01, 2012 While some instances of Stuxnet and Duqu found their way into seemingly unplanned locations, the majority of occurrences were localized to targeted systems. 10 steps toward eliminating insider threats September 27, 2012 If there's one threat in information security that's difficult to prevent, it's the insider threat. Centrify for Best Customer Service September 07, 2012 When it comes to customer service in the industry, Centrify believes they're the best, and hope to prove it with a win at the SC Awards. Axway for Best Email Security Solution Phishing is at an all time high, but Axway believes its email security solution is the answer. Researchers consider threat of car hacking By Danielle WalkerAugust 24, 2012 It's not necessarily new, but researchers are upping their work into discovering weaknesses in on-board automobile computers, which conceivably could allow an hacker to do harm. Why doesn't your VPN work on the road? August 24, 2012 August 15, 2012
LogMeIn We were asked to design some visualizations of the live activity flowing through the access enabled by LogMeIn, who provide the ability for one computer to log into another, anywhere on the globe. It turns out that they provide a lot of connections, with numbers upwards of 2k/ minute cropping up all the time, all over the planet. You can see what a truly global communication network looks like in real time in the map we made for LogMein, linked from the map images above and below. We also put together a more abstract visualization, from the point of view of the connections themselves—as opposed to the map, which is from the point of view of the globe. Each of the locations can access the most interesting photos on flickr for that place, further emphasizing the widely disparate locations that LogMeIn is enabling connections between. View Map / View Connection Endpoints
Turkey: Protest culture flowers at Istanbul's Taksim Square 12 concepts d'observatoire de l'activité Web en temps réel En 2010, nul ne peut ignorer le Web temps-réel : de la messagerie instantanée à Twitter, en passant par les conférences en ligne, les moteurs de recherche, les blogs, les wikis modifiables par chacun, le Web temps-réel est employé dans une très large panoplie de services. Évolution fondamentale de l'infrastructure d'Internet, le Web se veut de plus en plus synchrone avec la vie quotidienne de ses utilisateurs. Chaque service en ligne devient un producteur de flux d'information, eux-mêmes diffusés sur divers canaux de communication accessibles en temps réel. Ce sont les représentations graphiques de l'activité de ces canaux qui nous intéressent dans le cas présent : en effet, les services en ligne sont de plus en plus nombreux à expérimenter de véritables observatoires, sorte de mashup, rendant leur activité pratiquement palpable et visuellement quantifiable. Vous pouvez cliquer sur les images pour en savoir plus. Cette vidéo, intitulée "Yahoo! Passons à Twingly, le Wikio suédois.
The Internet map Research Our Records Skip Navigation. Research Our Records Home > Research Our Records Search Online Research in Person New to archival research? Get started using our site to find online records and records kept offline. Research a Specific Topic Perform research on people, places, events and other popular topics of interest. Research Your Ancestry Research Military Records Order Copies of Records Browse Online Exhibits PDF files require the free Adobe Reader. News and Notices Most Requested Today's Document March 7th: Bell's Telephone Patent Research Our Records > Connect With Us Online Research Resources For… Research Guides What's New
Generate Random Codes - Random Code Generator RANDOM.ORG - Password Generator <p style="background-color:#ffff90;padding: 0em .5em 0em .5em;font-size:.9em"><strong>Warning:</strong> Your browser does not support JavaScript – RANDOM.ORG may not work as expected</p> Do you own an iOS or Android device? Check out our app! This form allows you to generate random passwords. The passwords generated by this form are transmitted to your browser securely (via SSL) and are not stored on the RANDOM.ORG server. Need more options?
Strong Random Password Generator