
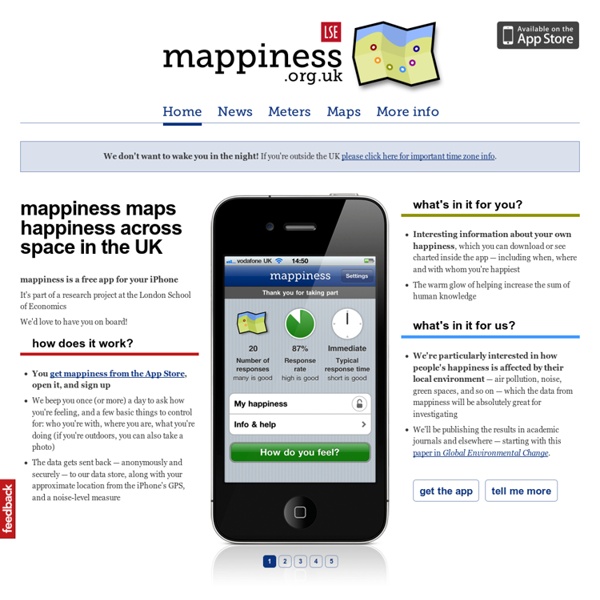
Mappiness iPhone App Maps Happiness (Say That Three Times Fast) Officially launching today is Mappiness, a UK iPhone app that “maps Happiness” by pinging users with a survey in order to plot out their feelings during the day (happiness, in this case, is apparently user-defined). Using LBS, the app links responses and response locations to environmental data in an attempt to, according to lead researcher George MacKerron, “better find answers on the impacts of natural beauty and environmental problems on individual and national well being.” MacKerron, based at the London School Economics, elaborated on the idea of tracking happiness, “In the 19th century economists imagined a ‘hedonometer,’ a perfect happiness gauge, and psychologists have more recently run small scale ‘experience sampling’ studies to see how mood varies with activity, time of day and so on.” Mappiness is the first project of its kind to add location to the mix. Now, thanks to the iPhone, we might get a better grasp on humanity’s happiness habits.
vous Emmanuel Gadenne from Limeil Brévannes ? Le 2.0 s'étoffe avec le "quantified self" (QS) Quantified Self from Jean Michel Billaut on Vimeo. (pour ceux qui ne le savent pas, Limeil Brévannes se trouvent dans le Val-de-Marne - Par ailleurs Emmanuel a eu quelques soucis avec son ordinateur pendant l'interview... la première partie de ce e-billautshow s'est faite avec le dit ordinateur, et suite au problème, nous avons continué avec son iPhone, qui marche très bien pour la visio...mais ne soyez pas perturbé par le changement de dimension d'écran.) On croyait que la messe était dite.. Que les outils dits du 2.0 étaient là, et qu'il n'y en auraient pas d'autres... Emmanuel nous explique donc par le menu ce dont il s'agit. Pour quels objectifs ? Combien de sites dans le monde proposent des enregistrements divers ? Où en est-on dans le Monde avec ce QS ? "Cela essaime un peu partout.. un peu sur la monde des barcamps..." Celui de Paris aura lieu en Juin prochain. Les Français sont-ils prêts pour cela ? Les professionnels de santé sont-ils intéressés par ces façons de faire ?
Google Maps Mania The Great Location Land Rush Of 2010 Back in November, at our Realtime CrunchUp event, I sat on the geolocation panel with members of Twitter, Foursquare, SimpleGeo, GeoAPI, Hot Potato, and Google. At one point, I raised the question if location was going to be the next battleground between startups large and small, much like social identity plays (Facebook Connect vs. Google Friend Connect) and status updates (Twitter vs. Facebook). All of the panelists indicated that it wouldn’t be, because they could all get along. How sweet. I’m sure some of them would counter that because location data is fairly standard right now, and moving easily between services, all of them will win. Twitter co-founder Evan Williams writes today that “We will be looking at how to integrate the work Mixer Labs has done with the Twitter API in useful ways…” and notes that they’ll be working on adding contextual local relevancy to tweets. What Twitter likely won’t be doing is getting into the core location platform business anytime soon. Game on.
Quantified Self | Self Knowledge Through Numbers Google Maps for iPhone 3GS, iPhone 4, iPhone 4S, iPhone 5, iPod touch (3rd generation), iPod touch (4th generation), iPod touch (5th generation) and iPad on the iTunes App Store SimpleGeo Locates $1.5 Million And Many Big Name Investors There is a lot of buzz around SimpleGeo right now. The service, which participated in our RealTime CrunchUp earlier this month, also took home two prizes at the Under The Radar conference just prior to that. And that was a big deal for the company considering it won the audience award even though it’s not exactly the most consumer-oriented project. SimpleGeo has just closed a $1.5 million seed round of funding, we’ve confirmed. The two founders, Matt Galligan and Joe Stump, who are both based in Boulder, CO, used their time in San Francisco this month to close this new round. SimpleGeo is not the only company working to provide an easy way for others to tap into the location craze. SimpleGeo remains in beta for the time being. Participants in its previous debt round include Joanna Shields (formerly Bebo), David Liu (formerly AOL), Ziv Navoth (formerly Bebo), Darius Contractor (Bebo), Ravi Narasimhan (Strategic Data Corp/NewsCorp), and Jason Knapp (Strategic Data Corp/NewsCorp).
Withings - Withings - La balance connectée (poids, IMC, masse gr quotes