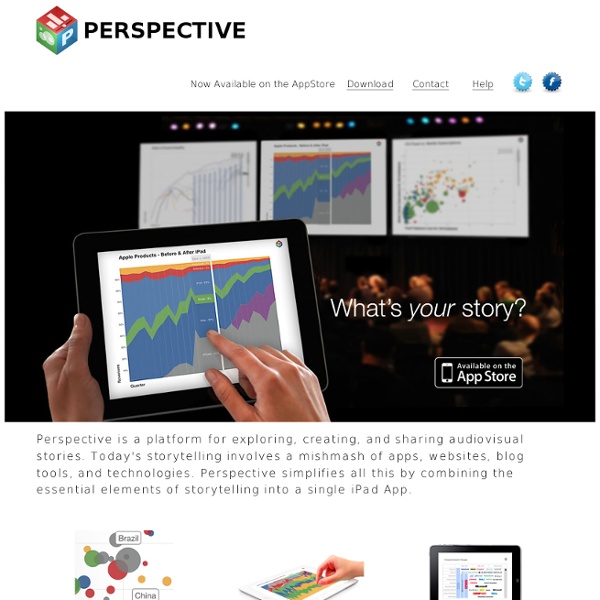
background preloader

Perspective

Perspective

Online Charts Builder Hohli Online Charts Builder New version: Try new version of Charts Builder, it based on new Google Charts API Load From Image URL: Chart Data can't equal to original, but very similar to it. Only for images on chart.apis.google.com Chart Type: 3D Pie charts Lines Bar charts Pie charts For Pie Charts with labels choose 1000x300 or 800x375 size Venn diagrams Scatter plots Radar charts Chart Size: 320x240 Horizontal 1000x300 800x375 600x500 320x240 Vertical 300x1000 375x800 500x600 240x320 Square 546x546 400x400 300x300 200x200 Chart Ads: Data: Should be consists only positive numbers, use minus one (-1) for missing value, separated by coma, space or semi(,; ), e.g.: 23, 432, 456, 341 For Lines (pairs): Input data as x-axis and y-axis coordinates, e.g.: x1,y1, x2,y2, x3,y3 Title: Use a pipe character (|) to force a line break in title. Background: Chart is ready you can save it as image Right click on the chart Select "Save image as" Save the image to your computer © 2011 Charts Builder. Developed by Anton Shevchuk

SlideKlowd - Turn Presentations into Conversations VisualEyes The 15 best tools for data visualisation | Design tools It's often said that data is the new world currency, and the web is the exchange bureau through which it's traded. As consumers, we're positively swimming in data; it's everywhere from labels on food packaging design to World Health Organisation reports. As a result, for the designer it's becoming increasingly difficult to present data in a way that stands out from the mass of competing data streams. Get Adobe Creative Cloud One of the best ways to get your message across is to use a visualization to quickly draw attention to the key messages, and by presenting data visually it's also possible to uncover surprising patterns and observations that wouldn't be apparent from looking at stats alone. As author, data journalist and information designer David McCandless said in his TED talk: "By visualizing information, we turn it into a landscape that you can explore with your eyes, a sort of information map. There are many different ways of telling a story, but everything starts with an idea.

Thinkmap visualization software facilitates communication, learning, and discovery. Chicago builds ETL toolkit for open data -- GCN Chicago builds ETL toolkit for open data By Stephanie KanowitzJan 16, 2015 Data officials in Chicago are churning out open datasets faster than ever by using technology rather than developers to get the job done. About a year ago, the city government embedded Pentaho Data Integration (PDI), a graphical extract-transform-load (ETL) tool with pre-built and custom components to process big data, into its OpenData ETL Utility Kit. Before working with PDI, city workers updated datasets manually, said Jon Levy, open data program manager at the Chicago Department of Innovation and Technology. That also meant Java developers were spending time on updates rather than writing applications that could help city workers and residents, added Tom Schenk, the city’s chief data officer. “What’s different now is we have a framework that can be easily used by a lot of people,” Schenk said. Chicago’s toolkit is free to download. At the end, you can publish the dataset. About the Author

Periscope Tools on Datavisualization.ch A Carefully Selected List of Recommended Tools 07 May 2012 Tools Flash, JavaScript, Processing, R When I meet with people and talk about our work, I get asked a lot what technology we use to create interactive and dynamic data visualizations. To help you get started, we have put together a selection of the tools we use the most and that we enjoy working with. Pathline: Connecting Designers With Scientists 18 Apr 2012 Tools We recently attended an interdisciplinary visualization workshop that was all about creating a dialogue between scientists, technologists and designers. New Maps for the Web by Stamen 22 Mar 2012 Tools JavaScript, Mapping I just left the Stamen studio where I had a brief chat with founder and CEO Eric Rodenbeck. The Visualizing Player 19 Jul 2011 Showcases, Tools Visualizing.org launched their brand new Visualizing Player, a terrific tool for embedding interactive and static data visualizations. Working with Data in Protovis 17 Feb 2011 Tools JavaScript, Tutorial Polymaps

Related: