
Projections and Distortion in the News A colleague today brought in a newspaper clipping from the weekend edition of the Wall Street Journal for 13-14 April, 2013. It was a map depicting the extimated range of North Korea’s Musudan missile. A couple of things were immediately interesting about this. First, the buffered area did not appear to actually be circular. Working with GIS, I am well aware projections will make us all SADD. The odd position of Alaska could be accounted for if the analyst used a local projection, one centered on Korea. When my colleague brought this to my attention a few minutes ago, he simply asked, “Does this seem right to you?” The slight elongation of the shape toward the north indicates a local projection was used. Next, we grabbed a country feature class from ArcGIS Online so we could not just buffer a point, but the whole country of North Korea. Before running the buffer tool, we also first made sure the country feature class had a geographic coordinate system.
The National Map Diseño cartográfico | Ecoter SC - Ecología y Territorio Como dice Wikipedia, la cartografía es la ciencia encargada del estudio y elaboración de mapas. Los mapas, por su parte, son una representación generalizada y precisa de fenómenos localizables en el espacio. Desde nuestro punto de vista, la elaboración de mapas es una ciencia que incluye a partes iguales, técnica, análisis y diseño. Los mapas son documentos importantes y de gran relevancia para la toma de decisiones territoriales y un instrumento de gestión necesario en la sociedad actual, independientemente de su formato. Por ello, a la hora de elaborar un mapa hemos de tener muy claros los objetivos de su realización, el propósito de su representación y a quién va dirigido. El conocimiento de los SIG, el buen gusto y el correcto uso de las variables cartográficas nos permitirá conseguir que nuestro mapa sea un documento válido. Dejemos de ser sólo analistas SIG y convirtámonos también en Cartógrafos. Color Use gudelines: Esquemas de color, tipos y combinaciones en nuestra leyenda.
Map design: a list of helpful online resources Whether they’ve been making maps for 20 years or two weeks, just like any designer, cartographers need inspiration when starting their latest project. Inspiration can come from many places and take many forms. Here at Ordnance Survey we use a range of resources and we want to share some of them with you. In this post we list several online resources that can help with your latest map design; from choosing the right colour palette to selecting great fonts. Although by no means a definitive list, these are some of the tools and resources that we refer to and use regularly and we have sorted them into four categories: colours, fonts, symbols and map inspiration: Colours The use of colour is very often fundamental to the success of a map. ColorBrewer 2.0 is a great tool for selecting colour schemes that are specific to maps, especially helpful when mapping various classes of data. Raphaeljs.com/picker is a nice, easy-to-use colour picker that returns a hex code. Fonts 1001 Free Fonts Dafont.com
SIGdeletras: Cartotecas Como ya comenté en una entrada pasada, el próximo día 12 de Julio tendré la oportunidad de participar en Carmona en el curso “Patrimonio Histórico: recursos en Internet” organizado por la Universidad Pablo de Olavide @olavidecarmona Estoy preparando la documentación para el curso y uno de los apartados en los que centraré mi charla-taller es en la identificación y uso de recursos digitales y páginas web que ofrecen al usuario cartografía histórica en formato digital. La cartografía histórica como elemento patrimonial puede ser como tal un objeto de estudio. Es también una fuente relevante de información para investigaciones históricas o/y geográficas donde la variable espacial tenga un papel relevante. A pesar de esto, y espero que gracias a vuestras aportaciones, creo que podría enriquecer bastante la experiencia de los alumnos con otros ejemplos locales, autonómicos o internacionales, con independencia de su escala. Antes de nada...
Derek Watkins La medida de la Latitud y la Longitud Hola a todos, Después de dos meses sin actualizar el blog os traigo una nueva entrada sobre un tema clave de la Ingeniería Cartográfica que es importante para entender la navegación moderna: como se calcula la latitud y la longitud. Líneas de paralelos y meridianos en un mapa con la proyección Mercator. Está claro que el canevás de meridianos y paralelos que vemos en los mapas nos sirven para poder situarnos sobre cualquier punto de la superficie terrestre. Determinación de la latitud La determinación de la latitud era algo ya sabido en la antigüedad, pues conforme nos movemos hacia el Norte o hacia el Sur cambian las estrellas que vemos y su altura sobre el horizonte. Latitud: gráfico esquemático. De ahí que el primer procedimiento para obtener la latitud fuese medir la altura de la estrella Polar sobre el horizonte. Constelación de la Osa Menor, a la cual pertenecen la Estrella Polar y Kochab. Cruz del Sur marcado en un recuadro amarillo (Fuente: WikiMedia) Determinación de la longitud
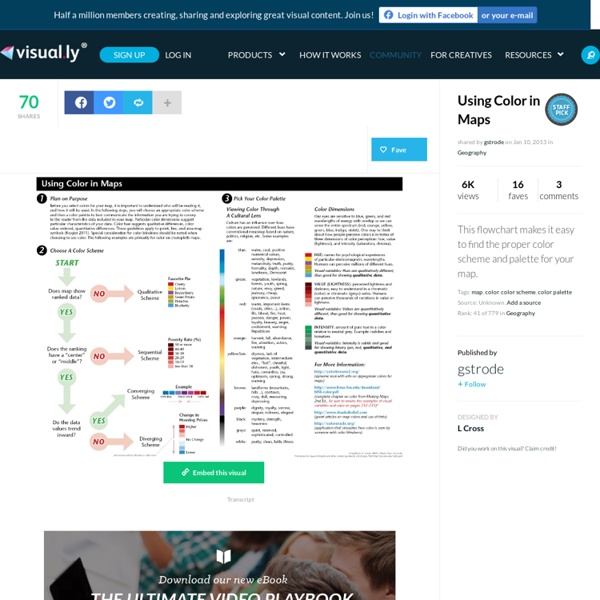
Ten Things to Consider When Making a Map What makes a good map? When done well, a map is a vehicle for effective communication. There are many cartographic principles to help guide effective map making. Below are ten common considerations that all cartographers should incorporate as part of their map making process. 1. The extent of the geographic area mapped will affect a whole slew of cartographic choices from the map projection used to data and symbology choices. 2. There are two main reasons to include data on a map: to support the subject matter of the map and to provide orientation (e.g. streets, cities, points of interest). 3. The choices of symbology can make or break a map. Consider the intended audience of the map when selecting design choices. 4. While it may be tempting to label all features shown on a map, doing so can block underlying features, create a cluttered looking map, and create confusion. In the example below, the use of labels creates a lot of noise on the map. India national highway map. 5. 6. 7. 8.
Should you be using intensity maps? | Bloom As a retailer, you’re probably used to using surveys as a means to understanding customer behavior. Traditionally, once you get the data, you might start working in excel or some other statistical software, cranking out brilliant correlations or percentage checks. There are plenty of available tools which can help you connect spatial and consumer profile data to better plan and manage services, but before you start applying survey results to business strategy, creating intensity maps could help you gain a better understanding of consumer behavior. What is an intensity map? An intensity map can show regional variations of consumer infrastructure density within a city and offer a bird’s eye view of locations where consumers exist within a city. What is the benefit of using an intensity map? Intensity maps allow large quantities of individual point data to be summed up and displayed in an easy to use manner. How to save time and money optimizing retail networks.