
Excel for Evaluation | Emery Evaluation Walk through the analytical process one technique at a time. Newest Tutorials Import and Merge Datasets Learn how to import, export, and merge datasets in Excel by using features such as text to columns, vlookup, and hlookup. Organize Your Spreadsheets When you’re staring at a spreadsheet for hours on end, a little organization can go a long way. Clean Data and Recode Variables Before you can analyze your data, you’ll need to check for missing data and recode some variables. Explore Your Dataset Use exploratory data visualization techniques like color-coding and sparklines find initial patterns. Calculate Summary Statistics (with Formulas) Summarize your data by finding the mean, median, standard deviation, and other descriptive statistics. Calculate Summary Statistics (with Pivot Tables) Pivot tables are the fastest, most accurate way to analyze your data — and they’re easier than you think. Putting It All Together Learn intermediate and advanced spreadsheet skills. Extra Time-Saving Techniques
AEA365 Hello, my name is Jayne Corso and I am the Community Manager for AEA. As a community manager, I create weekly posts for AEA’s Facebook and Twitter pages. Although you can share similar content on Facebook and Twitter, your approach should be unique for each channel. I have put together a few tips for composing text for both Facebook and Twitter. Facebook: Hot Tip: Keep it to 80 characters The Facebook character limit is technically 63,206; however, when posting on Facebook, you should try to keep your text within 80 characters. Hot Tip: Don’t just post a link Facebook is a great channel for sharing blog posts or linking to external content, but don’t just post the link. Hot Tip: Use images Facebook posts that use images receive more engagement than posts without images. Twitter: Hot Tip: Keep it simple Twitter has a character limit of 140, but studies have shown that posts that are 120-130 in length receive better engagement. Hot Tip: Grammar is still important Good luck crafting your posts!
ExcelUser Home Page MN student testing faces big cuts after lawmakers slash budget Listen Story audio Minnesota students will see big changes in the number of statewide exams they take next school year after the Legislature chopped Minnesota's testing budget in half during the special session. Lawmakers repealed several required high school tests and stopped paying for all juniors to take the ACT college entrance exam, something they had ordered in 2013. This was the first year for those payments. Two weeks after lawmakers finished their work, the Minnesota Department of Education is still combing through the education bill to see how the changes ordered by the Legislature will affect statewide assessments. The Minnesota Comprehensive Assessment GRAD tests in writing, reading and math will end. Gone as well are the Explore, Plan and Compass ACT tests, exams that helped students plan for college or a career. The MCA tests that students take every year in grades three through eight, and in 10th and 11th grades, will remain in place. Rep. State Sen.
How to Create an Excel Dashboard - The Excel Charts Blog The Excel Charts Blog Excel dashboards and executive reports are powerful, fairly easy to design and a great way to improve your Excel and data visualization skills. Because of its flexibility, you can virtually design any dashboard in Excel exactly the way you, or the users, imagined. And, best of all, you may want to implement it yourself or consider it a prototype and ask IT to implement it. Once you know what will the Excel dashboard be used for and what kind of metrics users expect, there are three major areas that you must address when creating it: how to bring data into your spreadsheets;how to manage the data and link it to the dashboard objects, like charts and tables;how to design the dashboard report. Let’s take a look at each of them. How to bring data into your Excel dashboard Yes, Excel is a very flexible tool, but to create an Excel dashboard you can’t just paste some data and add a few charts, can you? Usually, the data should not be entered directly into the spreadsheet. Named Ranges Macros
Overstretched school counselors would get state relief under new plan Listen Story audio Rosemount High School counselor Chad Terry helps students plan for college, work through emotional crises and pass their classes. Nearly 500 students depend on him. That's more than 100 students higher than the national average for secondary school counselors. Terry said he's overstretched and can't give students all the support they need. "I've met with 45 students in the last couple days, when I look back on my calendar." A proposal to fund grants for new support staff cleared its first legislative hurdle Thursday. Districts would match state funding for the first four years. Terry told a state Senate education committee the grants could help "close achievement gaps, educate and train students for jobs that are open now and in the future, and continue to work through the complications of an evolving mental health epidemic in our youth." Minnesota has one of the nation's worst student-to-counselor ratios. • More: Money for student counseling takes a back seat
Dashboards.ORG - A Practitioner's Guide to Business Intelligence - Dashboards.ORG Student support gets boost in Minnesota's supplemental budget School districts will have an opportunity to hire more social workers, counselors and other student support staff with a $12.1 million grant program included in the Legislature's end-of-session spending plan. Sen. Susan Kent, DFL-Woodbury, has pushed for the funding for several years. Last year's $95 million proposal didn't make it into the final budget. This year, she scaled back the request to $13.1 million, but the Republican-controlled House countered with a proposal to study the idea without dedicating money. "The House had a much smaller target than the Senate did for education, and the fact that, I think, in the process of compromise that ours is pretty close to intact — I think it sends an important signal about how much this is valued," Kent said. Education experts say support staff can be critical to keeping students at risk of dropping out of school on track for graduation. • Related: Without support, Minnesota students left behind at graduation Sen.
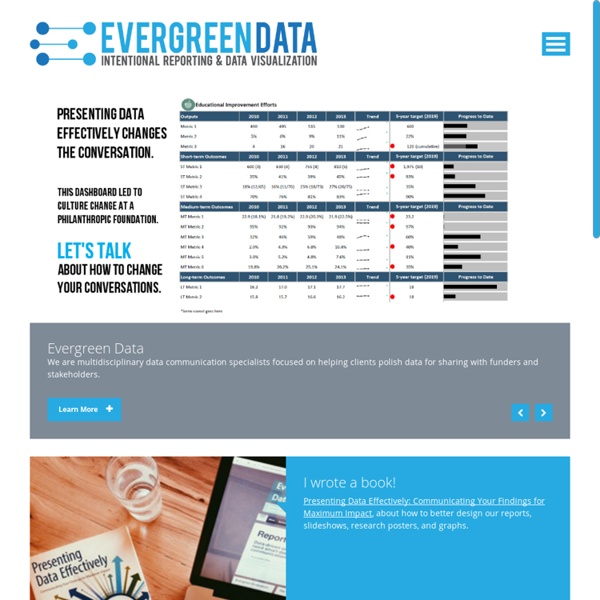
Give Your Managers More Insight, More Quickly, Using Less Time and Money Windows & Mac Excel Tens of thousands of Excel users in at least 160 countries are using my dashboard reports to improve business insight and WOW! their managers. Here's why... Good Excel dashboards can save hours of time...when you update your reports, and when your managers and other VIPs read them. Excel dashboards can present data from any number of sources in one report. They're created and maintained by users, who understand what the information means, not by programmers, who usually don't. They're a spreadsheet solution, not a macro solution. They can adapt quickly -- often, in minutes -- to managers' changing information needs. They can trap errors that normal reports typically ignore. And, because you already own Excel, your dashboard software costs nothing extra...it's free! Unfortunately, few people know how to create useable Excel dashboards. The kit includes my e-book, Dashboard Reporting With Excel, and more than 20 Excel workbooks. An Overview of the E-Book 1. 2. 3. 4. 5. 6. 7.
Money for student counseling takes a back seat Listen Story audio Lots of young, enthusiastic people want to be school counselors in Minnesota. Test scores and graduation data show there's plenty of need for the kind of support counselors provide. Without the intervention of counselors and other support staff, students can get off track for graduation, end up dropping out and find themselves with few options for employment. "Kids can't perform as well academically if they've got some social and behavioral issues that aren't taken care of," said Lauren Salonek, a graduate student in Minnesota State University Mankato's counseling program. • Related: Without support, Minnesota students left behind at graduation But compared to schools in other states, Minnesota schools don't hire many people like Salonek. School counselor-to-student ratios nationwide, 2014 MPR News graphic | Source: National Center for Education Statistics via American School Counselor Association He thinks Minnesota has put the issue on a back burner. State Sen.
Increase sales, motivate your employees - Plecto Without support, Minnesota students left behind at graduation When Xavier Simmons walked into class in high school, he'd turn his desk backwards, put his head down and go to sleep. He failed four classes his freshman year. Nobody called him on it, he said — not his mother, not his teachers, not his counselors. He dropped out the next year. "I didn't think of it as a big deal," Simmons said. • More: Xavier's story One might say Simmons, now 27 and lacking a high school diploma, got what he deserved. In the end, Simmons, who is African-American, was free to flounder in a state where students of color have some of the lowest graduation rates in the nation. Students like Simmons get knocked off track for a complex mix of reasons. Abysmal graduation rates for minority students have not only rattled education officials, but are worrying policymakers and civic leaders over the implications for Minnesota's economy. Many schools here and elsewhere have improved their graduation rates in part by following a simple formula of early intervention. So, what gives?
50 Free Productivity Dashboards and Templates Please raise your hand if you think redundant tasks suck. You know the ones I’m talking about – designing invoices, creating project roadmaps and writing business plans. Formatting charts and/or designing business invoices can be a time suck that add up overtime. But it doesn’t have to be. Stop reinventing the wheel, and download a free template or 50. Here are 50 free dashboards and templates, from Excel to PowerPoint and other software, including web-based applications. Business Planning & Projections Project Management OfficeTimeline has a library of free Gantt chart templates that help you manage all aspects of a project in a visual, easy-to-read way. Invoices Due offers numerous free templates and a dashboard to track your time on projects and create professional invoices that can even include your logo and brand. Financials Presentations Marketing & Sales DemandMetric has an Excel-based editorial calendar template that helps you track media opportunities. Personal Organization & Planning