
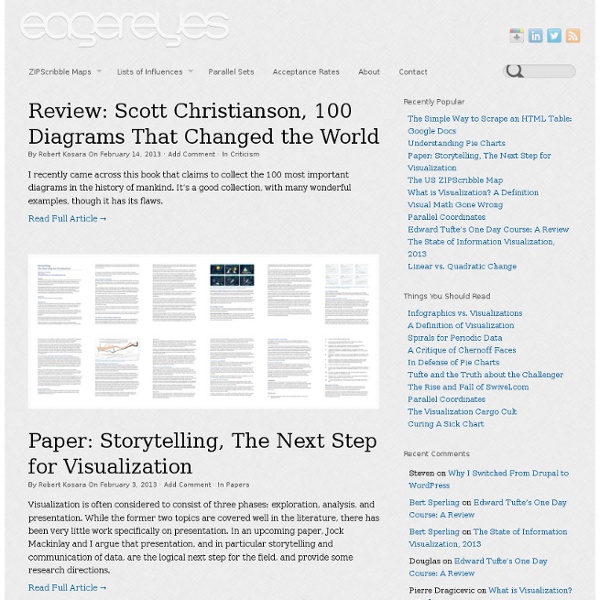
Junk Charts This post is part 2 of an appreciation of the chart project by Google Newslab, advised by Alberto Cairo, on the gender and racial diversity of the newsroom. Part 1 can be read here. In the previous discussion, I left out the following scatter bubble plot. This plot is available in two versions, one for gender and one for race. The key question being asked is whether the leadership in the newsroom is more or less diverse than the rest of the staff. The story appears to be a happy one: in many newsrooms, the leadership roughly reflects the staff in terms of gender distribution (even though both parts of the whole compare disfavorably to the gender ratio in the neighborhoods, as we saw in the previous post.) Unfortunately, there are a few execution problems with this scatter plot. First, take a look at the vertical axis labels on the right side. I find this decision confounding. The horizontal axis? Here is the same chart with improved axis labels: Re-labeling serves up a new issue.
Bloom Blog Prefuse: A Toolkit for Interactive Information Visualization Jeffrey Heer, Stuart K. Card, James A. Landay Although information visualization (infovis) technologies have proven indispensable tools for making sense of complex data, wide-spread deployment has yet to take hold, as successful infovis applications are often difficult to author and require domain-specific customization. To address these issues, we have created prefuse, a software framework for creating dynamic visualizations of both structured and unstructured data. prefuse provides theoretically-motivated abstractions for the design of a wide range of visualization applications, enabling programmers to string together desired components quickly to create and customize working visualizations. The prefuse toolkit is open source software and can be downloaded from Prefuse: A Toolkit for Interactive Information Visualization
Visualize this: Is it information or is it art? By John Grimwade An old infographic chestnut. It’s always been a tricky balance between getting the story across, and making a great image. But thanks to some serious computing power, we’ve arrived at a crunch point. In one corner of the ring is information, and in the other is art, and they’ve been slugging it out. Big revelation: The biggest trend in infographics right now is data visualization. A worrying aside: My students keep bringing stunning examples they have found on the Internet. Yes, in many cases, you really do have to be a rocket scientist to know what’s going on. All of this is not a problem at all, until… wild visualizations start masquerading as infographics. All Streets by Ben Fry. Wheat and Wages chart by William Playfair, 1821. Regulation/Innovation by Jer Thorp. Let’s not lose sight of the end user in this. Don’t get me wrong, there are some great data visualizations around, and I applaud them.
Part 1: The essential collection of visualisation resources This is the first part of a multi-part series designed to share with readers an inspiring collection of the most important, effective, useful and practical data visualisation resources. The series will cover visualisation tools, resources for sourcing and handling data, online learning tutorials, visualisation blogs, visualisation books and academic papers. Your feedback is most welcome to help capture any additions or revisions so that this collection can live up to its claim as the essential list of resources. This first part presents the data visualisation tools associated with conducting analysis, creating effective graphs and implementing business intelligence operations. Please note, I may not have personally used all tools presented but have seen sufficient evidence of their value from other sources. Microsoft Excel Find out more information | Cost: Trial > under £100/$150 per license | Tags: Spreadsheet, Office, Graphing Status: Ongoing (July 7, 2011) Open Office Calc Tableau Desktop
A Carefully Selected List of Recommended Tools on Datavisualization When I meet with people and talk about our work, I get asked a lot what technology we use to create interactive and dynamic data visualizations. At Interactive Things, we have a set of preferred libraries, applications and services that we use regularly in our work. We will select the most fitting tool for the job depending on the requirements of the project. Sometimes a really simple tool is all you need to create something meaningful. That’s why we have put together a selection of tools that we use the most and that we enjoy working with. Let me answer the most likely questions right away: No, not everything find its’ way into this list, so you might not find your personal favorite.
spaceengine - Home page 22 free tools for data visualization and analysis You may not think you've got much in common with an investigative journalist or an academic medical researcher. But if you're trying to extract useful information from an ever-increasing inflow of data, you'll likely find visualization useful -- whether it's to show patterns or trends with graphics instead of mountains of text, or to try to explain complex issues to a nontechnical audience. There are many tools around to help turn data into graphics, but they can carry hefty price tags. The cost can make sense for professionals whose primary job is to find meaning in mountains of information, but you might not be able to justify such an expense if you or your users only need a graphics application from time to time, or if your budget for new tools is somewhat limited. Here's a rundown of some of the better-known options, many of which were demonstrated at the Computer-Assisted Reporting (CAR) conference last month. Data cleaning DataWrangler What's cool: Text editing is especially easy.
DIVA: Dynamic Interactive Visualization The Thanksgiving white-paper Introduction Diva is a software infrastructure for visualizing and interacting with dynamic information spaces. We characterize the design process, particularly in the early stages of design, as one of exploration of the design space. In later stages of the design process, the problem changes becomes, in some ways, "larger but simpler." High-level goals Diva came about through the convergence of several key factors. One of the problems we see with conventional approaches to visualization in systems design is that "visualization" tends to mean after-the-fact, impoverished summaries of an execution or simulation. Furthermore, although parts of the system are often described in a graphical notation (state charts, dataflow diagrams, circuit schematics, and so on), execution and algorithm visualization is a completely separate process. We are also disconcerted by the lack of attention to fluidity and usability of many of our tools. Architecture Driving projects
Big Data means Advanced Data Visualization The last few years have been particularly exciting for data visualizations. We’ve witnessed a boom in the popularity of infographics and in tools to help create everyday visualizations for practical purposes. With all these exciting developments it’s difficult not to wonder what the future of this field will look like. Industry-renowned data visualization expert, Edward Tufte once said “The world is complex, dynamic, multidimensional; the paper is static, flat. How are we to represent the rich visual world of experience and measurement on mere flatland?” Tutfe brings up a valid point. There’s a growing problem that businesses are facing. We’re seeing the development of new data visualization techniques, what Forrester is referring to as Advanced Data Visualization (ADV). Dynamic data contentVisual queryingMultiple-dimension, linked visualizationAnimated visualizationPersonalizationBusiness-actionable alerts Curious and want to learn more about ADV vendors? Related
Texas drought maps and photos | NPR StateImpact Various plans for dealing with future droughts and growing demand for water in Texas exist, but most comprehensive — and accepted — is the state Water Plan. It offers a frank assessment of the current landscape, saying Texas “does not and will not have enough water to meet the needs of its people, its businesses, and its agricultural enterprises.” It predicts that “if a drought affected the entire state like it did in the 1950s,” Texas could lose around $116 billion, over a million jobs, and the growing state's population could actually shrink by 1.4 million people. The water plan also offers a range of solutions for dealing with the problem, focusing mainly on conservation and efficiency, but also on building new reservoirs, tapping additional sources of water underground and treating effluent water. Conservation Texas’ population is expected to increase 82 percent over the next 50 years, but the amount of water the state needs is expected to decline. New Reservoirs Treating Wastewater
"Visualizing 'Big Data' in the Arts and Humanities | Humanities Institute On Wednesday, September 26, 2012 from 3:00pm to 4:30pm in 150A Thompson Library, the Humanities Institute and the Digital Arts and Humanities Working Group will host a panel discussion on "Visualizing 'Big Data' in the Arts and Humanities.” Panelists David Staley (History), Jessie Labov (Slavic & East European Languages & Cultures), and H. Lewis Ulman (English) will explore the place of data visualization as a form of humanities scholarship, with visualization as the hermeneutic act that allows humanists to read “big data.” The panel will describe the creation of the Humanities Visualization Studio at The Ohio State University to conduct such humanistic readings of big data. David Staley is Director of The Goldberg Center and an associate professor in the Department of History at The Ohio State University. Jessie Labov is Assistant Professor in the Department of Slavic and East European Languages and Cultures. editing, and rhetorical theory, history and criticism.
Fast Thinking and Slow Thinking Visualisation Last week I attended the Association of American Geographers Annual Conference and heard a talk by Robert Groves, Director of the US Census Bureau. Aside the impressiveness of the bureau’s work I was struck by how Groves conceived of visualisations as requiring either fast thinking or slow thinking. Fast thinking data visualisations offer a clear message without the need for the viewer to spend more than a few seconds exploring them. The explicit message of this map is that surprisingly large distances are covered across the network and that the Central Line rolling stock travels furthest. or the seemingly impenetrable (from a distance at least), but wonderfully intricate hand drawn work of Steven Walter (click image for interactive version). I have seen bad examples of both slow thinking and fast thinking maps but there is undoubtedly more rubbish in the latter category. So do the renowned folks at the NY Times Graphics Dept. prefer fast or slow thinking visualisations?
Why Is Data Visualization So Hot? Noah Iliinsky is the co-author of Designing Data Visualizations and technical editor of, and a contributor to, Beautiful Visualization, published By O’Reilly Media. He will lead a Designing Data Visualizations Workshop at O’Reilly’s Strata conference on Tuesday, Feb. 28. Data visualization is hot. All of a sudden there are dozens of companies and products that want to help you visually analyze your data, build your own visualizations, and visually display interesting data sets of all kinds. To answer these questions, we need to go all the way back to biology. That last factor, pattern matching, is the key when it comes to discussing the benefits of presenting information visually. Let’s look at the classic instructive example, Anscombe’s Quartet, devised by statistician Francis Anscombe to demonstrate this very issue. All of a sudden, the data sets look very different from each other, and you can’t help but see and understand much more about the underlying numbers; that’s the magic.