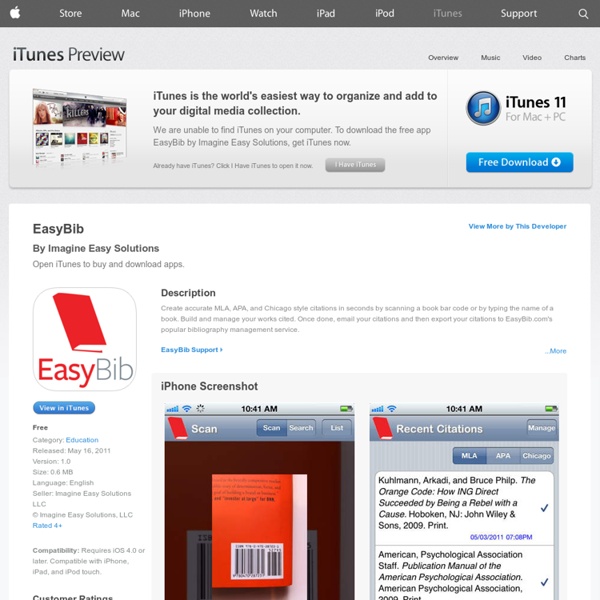


EasyBib: Free Bibliography Generator - MLA, APA, Chicago citation styles My MLA Summary iCyte Grammar Basics and Advanced Lite APA Formatting and Style Guide Summary: APA (American Psychological Association) style is most commonly used to cite sources within the social sciences. This resource, revised according to the 6th edition, second printing of the APA manual, offers examples for the general format of APA research papers, in-text citations, endnotes/footnotes, and the reference page. For more information, please consult the Publication Manual of the American Psychological Association, (6th ed., 2nd printing). Contributors: Joshua M. Please use the example at the bottom of this page to cite the Purdue OWL in APA. To see a side-by-side comparison of the three most widely used citation styles, including a chart of all APA citation guidelines, see the Citation Style Chart. You can also watch our APA vidcast series on the Purdue OWL YouTube Channel. General APA Guidelines Your essay should be typed and double-spaced on standard-sized paper (8.5" x 11"), with 1" margins on all sides. Major Paper Sections Title Page Running head: TITLE OF YOUR PAPER
Easy Writer Lite Summary MeeGenius! Books - The Read-Along Educational App for Children, Parents and Teachers www.creativebloq.com/design-tools/data-visualization-712402 It's often said that data is the new world currency, and the web is the exchange bureau through which it's traded. As consumers, we're positively swimming in data; it's everywhere from labels on food packaging design to World Health Organisation reports. As a result, for the designer it's becoming increasingly difficult to present data in a way that stands out from the mass of competing data streams. Get Adobe Creative Cloud One of the best ways to get your message across is to use a visualization to quickly draw attention to the key messages, and by presenting data visually it's also possible to uncover surprising patterns and observations that wouldn't be apparent from looking at stats alone. As author, data journalist and information designer David McCandless said in his TED talk: "By visualizing information, we turn it into a landscape that you can explore with your eyes, a sort of information map. There are many different ways of telling a story, but everything starts with an idea.
Free Books - 23,469 classics to go. Summary