Metrics
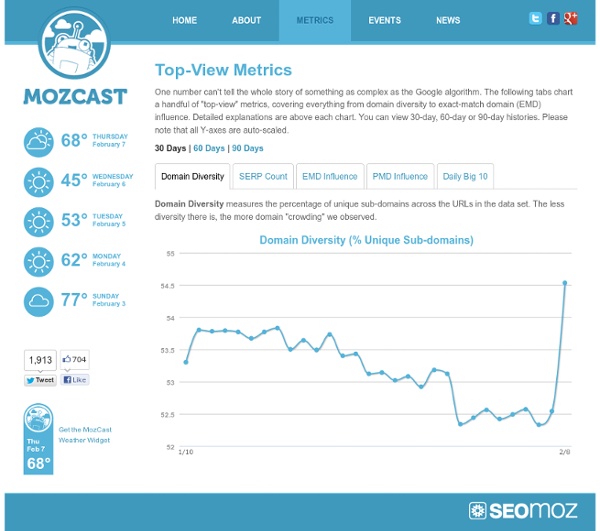
One number can't tell the whole story of something as complex as the Google algorithm. The following tabs chart a handful of "top-view" metrics, covering everything from domain diversity to exact-match domain (EMD) influence. Detailed explanations are above each chart. You can view 30-day, 60-day or 90-day histories. Domain Diversity measures the percentage of unique sub-domains across the URLs in the data set. SERP Count tracks the recent trend of SERP "shrinkage" – Google results with less than 10 organic listings on the first page. EMD Influence measures the percentage of top 10 results held by exact-match domains. PMD Influence measures the percentage of top 10 results held by partial-match domains, excluding EMDs. Big 10 Influence tracks the percentage of page one results held by the top 10 sub-domains. Today's "Big 10" Domains:
Metrics, Metrics On The Wall, Who's The Vainest Of Them All? Actionable vs. Vanity
More data is always a good thing right? More data means more information and more accurate decisions. More data means we’ll be able to build our business faster. Wrong. Completely and utterly wrong. Not all data is helpful. How to Tell if Your Data Matters It all comes down to one thing: does the metric help you make decisions? If you don’t, you’re probably looking at a vanity metric. Vanity metrics are all those data points that make us feel good if they go up but don’t help us make decisions. There’s no way to know. Let’s look at an actionable metric. It says “HOLY SNACK ATTACK BATMAN! So we check our merchant account and see if payments are still coming in. Notice how there’s no confusion and no ambiguity. “But Lars! Have you revamped your site design or checkout funnel in the last 12 months? Actionable Metrics Whenever you start tracking a metric ask yourself if it helps you take action and make decisions. At their core, actionable metrics are geared to answer these questions: Revenue
Related:
Related: