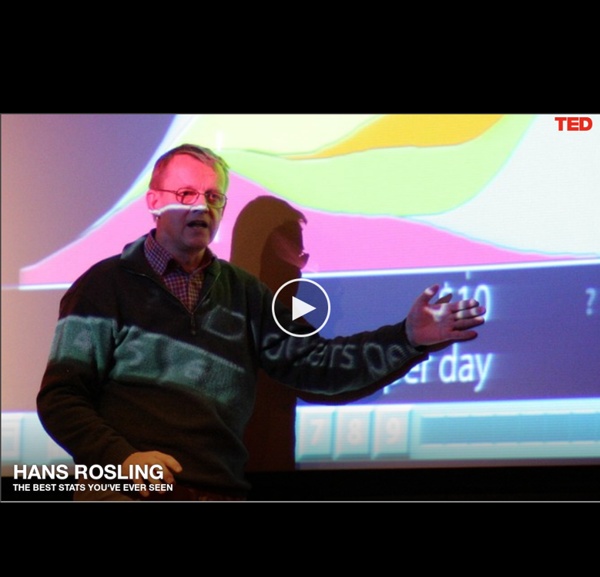


http://www.ted.com/talks/hans_rosling_shows_the_best_stats_you_ve_ever_seen.html
Michael Deal ◊ Graphic Design Ongoing study of Beatles through infographics, much of which is based on secondary sources such as sales statistics, biographies, recording session notes, sheet music, and raw audio readings. This graphic traces songwriting contributions by different band members (data based on authorial attributions quantified by William J. Dowlding in the book Beatlesongs Longwinded notes: Color patterns offer clues about the band's gradual fracturing as each member became more independent. Red stalks (signifying jointly written songs) decrease in the second half of the timeline; the split-color bars give way to solid bars of a single color.
Centre for Multilevel Modelling Professor Goldstein is a chartered statistician, has been editor of the Royal Statistical Society's Journal, Series A, a member of the Society's Council and was awarded the Society's Guy medal on silver in 1998. He was elected a member of the International Statistical Institute in 1987, and a fellow of the British Academy in 1996. He was awarded an honorary doctorate by the Open University in 2001. Research interests There are three main foci of my research interests.
Various ways to rate a college There are a bunch of college ratings out there to help students decide what college to apply to (and give something for alumni to gloat about). The tough part is that there doesn't seem to be any agreement on what makes a good college. Alex Richards and Ron Coddington describe the discrepancies.
Zip Codes, Area Codes, and other Reference Information U.S. Postal/Zip Codes Listings: Zip codes by city Research: Lev Manovich Coins the Term 'Media Visualization' New media theorist Lev Manovich just released a new text, titled What is Visualization? [manovich.net]. One might first wonder if such a question is not too... obvious, but in the light of the contentious discussion about the tension between artistic and scientific representations of data, and whether data art should be called visualization at all, it is always worth covering the basics. The text is quite substantial, so you might want to wait for some quiet time to dive into it.
Education Resources Information Center Introduction: Action Research is a formative study of progress commonly practiced by teachers in schools. Basically an action research is a spiral process that includes problem investigation, taking action & fact-finding about the result of action. It enables a teacher to adopt/craft most appropriate strategy within its own teaching environment. Objective: The objective of present work is to study the effectiveness & advantage of Action Research at higher education level. Bio-Statistics taken as difficult, dry & non-interesting subjects by most of the biological sciences students was selected for the study. Methodology: Practical Action Research (one of its mode) was chosen as a scheme of study to address the major problems of these students.
Protein Data Bank A Structural View of Biology This resource is powered by the Protein Data Bank archive-information about the 3D shapes of proteins, nucleic acids, and complex assemblies that helps students and researchers understand all aspects of biomedicine and agriculture, from protein synthesis to health and disease. As a member of the wwPDB, the RCSB PDB curates and annotates PDB data. The RCSB PDB builds upon the data by creating tools and resources for research and education in molecular biology, structural biology, computational biology, and beyond.
World Statistics including country capitals, area, population [Stats were last updated 07-Dec-2008] Sort by: Country | Area | Population City-specific population statisticsWorld's Largest CitiesWorld's Largest Urban AreasCountry Population Projections Sources Other reference Informationmongabay.comTropical rainforest informationTropical freshwater fish informationImages / Photos Datasets on Datavisualization Wikileaks US Embassy Cables 29 Nov 2010 Datasets Infographic, Politics Wikileaks began on Sunday November 28th publishing 251,287 leaked United States embassy cables, the largest set of confidential documents ever to be released into the public domain. Here's how media outlets strive to make the data more accessible than its original form. Read more