
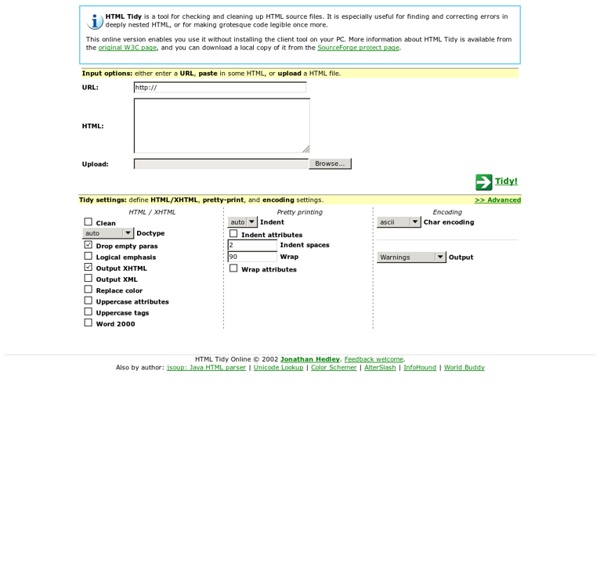
Web Page Analyzer - free website optimization tool website speed test check website performance report from web site optimization Free Website Performance Tool and Web Page Speed Analysis Try our free web site speed test to improve website performance. Enter a URL below to calculate page size, composition, and download time. The script calculates the size of individual elements and sums up each type of web page component. Help Speed Up the Web Tired of waiting for slow web sites? <a href=" Page Analyzer</a> - Free web page analysis tool calculates page size, composition, and download time. Consider optimizing your site - with our Website Optimization Secrets book, contacting us about our optimization services, or our Speed Tweak tutorials. Related Website Optimization Services Try our targeted services to optimize your web site's ROI. Version History See the version history for all revisions.
Graphical vi-vim Cheat Sheet and Tutorial Learning vi or vim is not easy. But it doesn't have to be that difficult, either. It is, in any case, faster, more powerful, and more productive than editing with any other editor, so you would do very well in investing the time and effort to learn it. Being a vi lover myself, I came up with the idea of providing a graphical cheat sheet for those learning vi or vim, and I also found out it was a very good way to structure a tutorial. By the way, I recently published the definitive article explaining why vi/vim editing is so much better than regular editing. Graphical cheat sheet This is a single page describing the full vi/vim input model, the function of all keys, and all major features. Graphical cheat sheet based tutorial The tutorial above is structured in 7 lessons that cover the major commands in vi/vim. Notes vim is an incredible editor by Bram Moolenaar, based on the original vi by Bill Joy, adding a ton of improvements over it. Relevant links Why, oh why, do those #?
Internet Explorer Developer Toolbar The Microsoft Internet Explorer Developer Toolbar provides a variety of tools for quickly creating, understanding, and troubleshooting Web pages. The Internet Explorer Developer Toolbar provides several features for exploring and understanding Web pages. These features enable you to:Explore and modify the document object model (DOM) of a Web page.Locate and select specific elements on a Web page through a variety of techniques.Selectively disable Internet Explorer settings.View HTML object class names, ID's, and details such as link paths, tab index values, and access keys.Outline tables, table cells, images, or selected tags.Validate HTML, CSS, WAI, and RSS web feed links.Display image dimensions, file sizes, path information, and alternate (ALT) text.Immediately resize the browser window to a new resolution.Selectively clear the browser cache and saved cookies. Loading your results.
BrowserCam : Browser testing and cross browser compatibility testing products and tools, including free cross browser testing tool. TextWrangler TextWrangler TextWrangler is an all-purpose text and code editor for Mac OS X, based on the same award-winning technology as BBEdit, our leading professional HTML and text editor. We will be eventually retiring TextWrangler from our product line, and so we encourage anyone interested in TextWrangler to download and use BBEdit instead. We’ve put together a handy chart comparing BBEdit and TextWrangler, to help you out. Should I upgrade to BBEdit? BBEdit is TextWrangler’s elder sibling. A better free alternative BBEdit offers a 30-day evaluation period, during which its full feature set is available. After the evaluation period, BBEdit provides a modified set of features, which incorporates all of TextWrangler's features, and offers unique features of its own. How do I get BBEdit? Download BBEdit here. If you already have BBEdit and would like to update to the latest version, please go to our updates page. How do I get TextWrangler? Download TextWrangler here. TextWrangler System Requirements
Netrenderer Lorem Ipsum - All the facts - Lipsum generator TextMate — The Missing Editor for Mac OS X Link Evaluator a Firefox extension for evaluating links and linked content. Download it now! Overview Link Evaluator is a Firefox extension designed to help users evaluate the availability of online resources linked to from a given Web page. Link Evaluator examines both the HTTP status code and the page contents returned by each URL, and attempts to distinguish between various results such as: broken links (404) network time-outs authentication failure, and "incorrect" content for the given URL. After each link is checked, it is highlighted with a color based on the relative success of the result: green for fully successful, shades of yellow for partly successful, and red for unsuccessful. Link Evaluator is capable of detecting "red-flag" and "green-flag" phrases embedded in Web content specifically for checking links, i.e. text that is likely to indicate a Web page has been successfully reached or not. Technical Requirements, License Information Installation Instructions How to Use Profiles
4 Cross-Browser Testing Tools : Business Collaboration News " No matter what other presences you may have on the web, your own website is still a must. Professionally-designed websites should, of course, look good no matter what browser a user has. But it’s surprisingly tough to test all the ways that your site may look. The web development company that I manage maintains a series of machines so that we can check the sites we design in a multitude of environments. But if such a setup isn’t feasible for you, you might want to try one of these options for cross-browser testing. Browsershots This web-based service is simple and offers a comprehensive set of browsers. I asked Browsershots to display its default selection of 63 browsers. Browsershots is free, but you can purchase “priority processing” to improve load time for $29.95 per month. Spoon Browser Sandbox This web-based service tries to go further than just providing screenshots by offering interactive views from several versions of Firefox, Chrome and Opera. Browserling Multi-Browser Viewer
Dragonfly documentation The Remote Debug feature allows Opera Dragonfly to connect to other instances of Opera, either on the same machine or on a remote device. This is especially useful when working with devices such as mobile phones, tablets, and TVs. When put into Remote Debugging mode, Opera Dragonfly will listen for a connection to the IP address and Port specified. The separate instance of the Opera browser can then connect over a network and pass debugging information across the connection. Opera Dragonfly can then interact with the webpages and applications on the remote instance, just as if it were running locally. Setup The following steps create the setup for a remote debugging session. Stage 1: Network setup The first step is to make sure both instances are connected to the same network, so they can "see" each other. In OS X, the quickest way to find the IP address of your machine is to go to the system's Network preferences. In both OS X and Linux it is also possible to go the command-line route.