background preloader

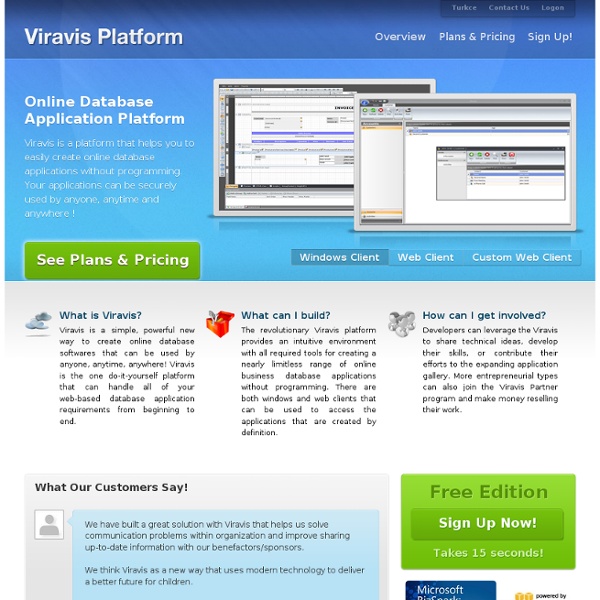
Online Database Application Platform

Online Database Application Platform

Sheppard Software: Fun free online learning games and activities Formstack: Easy Web Forms With Sophisticated Options I was recently asked to add a couple of forms to a client’s website. Over the years, my company has built a number of solutions for creating forms, notifying clients, and storing the collected data, but they all take some manual setup, and the client wanted the forms in a hurry. So I figured that I would try Formstack, based on Darrell’s recommendation from a few months ago. Since Darrell wrote about this product, its name has changed from Formspring to differentiate itself from Formspring.me, a social network project from the same company. But as he described, it’s very easy to set up forms, and they can be embedded in existing websites by copying the HTML code that Formstack creates. Of course, creating forms is just the beginning of the data collection process. In addition, Formstack has other useful features, including charts and graphs showing form submissions. Formstack has several pricing plans, including a free starter plan. Do you use Formstack?

Glom Datavisualization.ch audiotool.com 3 Audacity Tips To Enhance Any Recorded Interview Regardless what you intend to do with the interview, one thing that’s for certain is that you want to develop a reputation as a professional interviewer that produces high-quality, interesting conversations with fascinating people. Only part of the recipe for this is developing interesting and thoughtful questions for your interviewee to answer, but the other significant part of the equation is how well you’ve edited the audio interview into a high-quality, professional show. Many avid audio enthusiasts may find some of the edits below somewhat simple, but for the blogger or podcaster with little audio editing experience, these tips are critical to know. 3 Tips To Enhance Your Interview Audio With Audacity I use the Audacity audio recording software to record and edit all of my interviews. The beauty of Audacity is that you have the capability to “fix” those flaws. Before we start doctoring the audio file with the Audacity audio recording software, let me first introduce the patient.

Protovis Protovis composes custom views of data with simple marks such as bars and dots. Unlike low-level graphics libraries that quickly become tedious for visualization, Protovis defines marks through dynamic properties that encode data, allowing inheritance, scales and layouts to simplify construction. Protovis is free and open-source, provided under the BSD License. It uses JavaScript and SVG for web-native visualizations; no plugin required (though you will need a modern web browser)! Protovis is no longer under active development.The final release of Protovis was v3.3.1 (4.7 MB). This project was led by Mike Bostock and Jeff Heer of the Stanford Visualization Group, with significant help from Vadim Ogievetsky. Updates June 28, 2011 - Protovis is no longer under active development. September 17, 2010 - Release 3.3 is available on GitHub. May 28, 2010 - ZOMG! October 1, 2009 - Release 3.1 is available, including minor bug fixes. April 9, 2009 - First release on Google Code. Getting Started

PROMT - Free Online Translator and dictionary - English, German, Welcome arbor.js SEO With Google Webmaster Tools - Part 3: Your Site on the Web OK, so you've got your site set-up and configured in Google Webmaster tools. Now it's time to start looking at the data. Your Site on the Web Google Webmaster Tools allows you to view some basic stats and data for your site. Top Search Queries This section of Google Webmaster Tools gives you information on what keywords people are using to find your site. Just because a keyword query isn't listed here doesn't mean it is not a good keyword to go after. Onto the data... At the top you can filter the results by image, mobile, smartphone and web search results. You can also filter results by country. Finally, you can filter the results by date range. At the top you can see a graph of your site impressions and clickthroughs for the selected period of time along with the totals. Just below that are four columns of data. Now let's look at the data displayed, what it means and how you can apply it to your SEO campaign. Each of the queries is expandable to allow you to get even more detailed stats.

Related: