
peoplemovin - A visualization of migration flows Breathingearth - CO2, birth & death rates by country, simulated real-time circular_flow.wmv National income, output, and expenditure are generated by the activities of the two most vital parts of an economy, its households and firms, as they engage in mutually beneficial exchange. The primary economic function of households is to supply domestic firms with needed factors of production - land, human capital, real capital and enterprise. The factors are supplied by factor owners in return for a reward. Land is supplied by landowners, human capital by labour, real capital by capital owners (capitalists) and enterprise is provided by entrepreneurs. Firms The function of firms is to supply private goods and services to domestic households and firms, and to households and firms abroad. Factor incomes Factors of production earn an income which contributes to national income. Members of households pay for goods and services they consume with the income they receive from selling their factor in the relevant market. Production function Q = f (L, La, K) Video The Circular flow of income
Looking back, ahead at federal taxing, spending Looking back, ahead at federal taxing, spending By John Waggoner, Julia Schmalz, Joshua Hatch and William Couch, USA TODAY This tax calculator will give you a rough idea of your federal tax bill — and where your tax money went — from 1940 through 2010. Caveats: The calculator is for a taxpayer who files individually, uses the standard deduction instead of itemizing, and has one exemption. The calculator also figures your Social Security and Medicare taxes. We've adjusted all figures for inflation, using the consumer price index. Regarding how the federal government spends those tax dollars, we broke out each tax bill into the amount that would be allocated among the government's broad spending categories. So, take some time to explore. Questions? Guidelines: You share in the USA TODAY community, so please keep your comments smart and civil.
World debt comparison: The global debt clock A Decade of Tax Cuts and Deficits The U.S. national debt’s path from $5.8 trillion in 2001 to $15.9 trillion as of Aug. 1, plus two opposite scenarios for how Congress could deal with the impending fiscal cliff. Photograph by Nicolas McComber/ISTOCK; Data: Congressional Budget Office, Congressional Research Service
Elaborating on this theme, this post shows at a high level why the Greek issues have ripple effects on the other side of tthe world - in fact in all countries will low deposits and savings... by xavier_ May 7
In any case the euro zone is at a cross road. This crisis shows that it should either integrate further eco policies or... by wallen May 6
Difficult to say. The drama for Greece is that it can't depreciate neither leave the euro and default would not help that much (they still have 8-10% primary deficit). Germany and France have ok level of debt (at least for now). More importantly they are more "protected" than Greece because if they were in danger the ECB would depreciate the euro thus giving some breading space. Actually, if Italy or Spain enter the dance that's maybe what the ECB will do. by wallen May 6
True, and with economies like Germany and France in the mix, how is the ECB supposed to respond to current levels of sovereign debt? by jeason May 6
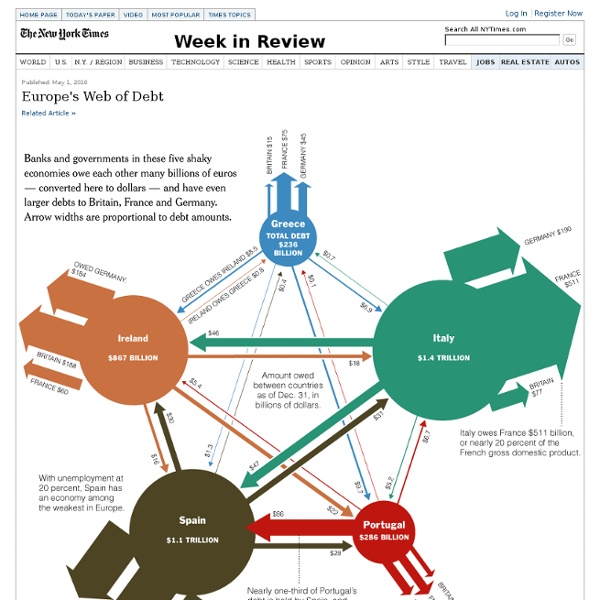
In a way it's normal, that's EU integration at work... but it shows the domino effect if one of them defaults. by wallen May 5