
News GPS-Prot visualization platform The GPS-Prot visualization platform by the HARC Center at UCSF uses TouchGraph Navigator to display display HIV-Host interactions or the Human interactome. Melanie Bennett Brewer and Marie Fahey worked with TouchGraph to develop GPS-Prot GPSProt.org, a web based tool that groups proteins into functional modules or protein complexes, generating more intuitive network representations and also allows for the uploading of user-generated data. A published article in BMC Bioinformatics provides more information about this application. NY Times: Your Life in Graphs New York Times article by Peter Wayner features the TouchGraph Facebook visualization, along with other tools for "Illustrating Your Life in Graphs and Charts". Mr. You can add the TouchGraph Facebook Application to display your own social network. Twitter visualization of Hashable Visualization of Twitter activity of data from popular social networking tool Hashable. TouchGraph SEO TouchGraph SEO is live!
Award#0705832 - III-COR: iOPENER - A Flexible Framework to Support Rapid Learning in Unfamiliar Research Domains Award Abstract #0705832 III-COR: iOPENER - A Flexible Framework to Support Rapid Learning in Unfamiliar Research Domains In today's rapidly expanding disciplines, scientists and scholars are constantly faced with the daunting task of keeping up with knowledge in their field. In addition, the increasingly interconnected nature of real-world tasks often requires experts in one discipline to rapidly learn about other areas in a short amount of time. Cross-disciplinary research requires scientists in such areas as linguistics, biology, and sociology to learn about computational approaches and applications. Both students and educators must have access to accurate surveys of previous work, ranging from short summaries to in-depth historical notes. Note: When clicking on a Digital Object Identifier (DOI) number, you will be taken to an external site maintained by the publisher. Some links on this page may take you to non-federal websites. Radev, Dragomir R. Radev, Dragomir R. Shneiderman, B..
Deep Web Search Engines | Deep Web Search - A How-To Site Where to start a deep web search is easy. You hit Google.com and when you brick wall it, you go to scholar.google.com which is the academic database of Google. After you brick wall there, your true deep web search begins. You need to know something about your topic in order to choose the next tool. To be fair, some of these sites have improved their index-ability with Google and are now technically no longer Deep Web, rather kind-of-deep-web. However, there are only a few that have done so. To all the 35F and 35G’s out there at Fort Huachuca and elsewhere, you will find some useful links here to hone in on your AO. If you find a bad link, Comment the link below. Last updated July 12, 2016 – updated reverse image lookup. Multi Search engines Deeperweb.com – (broken as of Sept 2016, hopefully not dead) This is my favorite search engine. Surfwax – They have a 2011 interface for rss and a 2009 interface I think is better. Cluster Analysis Engine Speciality Deep Web Engines General Books Online
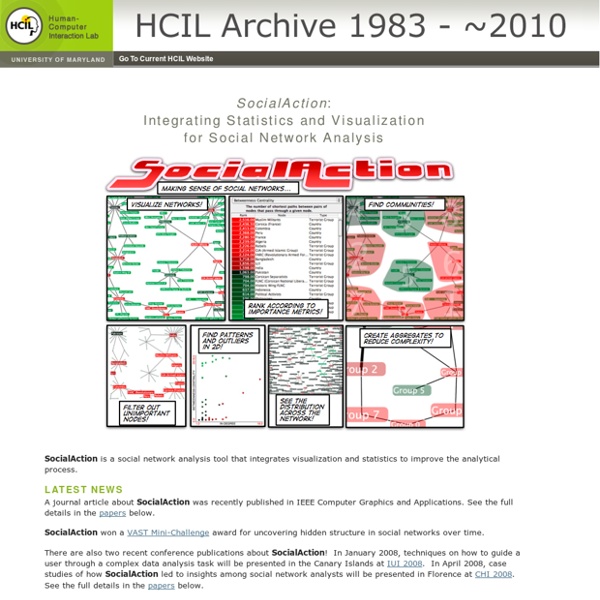
Action Science Explorer (Formerly iOpener Workbench) Latest News January 2012. Our paper on Action Science Explorer was accepted by JASIST, the Journal of the American Society for Information Science and Technology. December 2011. July 2010. Description The goal of the iOpener project is to generate readily-consumable surveys of different scientific domains and topics, targeted to different audiences and levels. Action Science Explorer is partially an integration of two powerful existing tools the SocialAction network analysis tool and the JabRef reference manager. JabRef supplies all the features one would expect from a reference manager, including searching using simple regular expressions, automatic and manual grouping of papers, DOI and URL links, PDF full text with annotations, abstracts, user generated reviews and text annotations, and many ways of exporting. These tools are linked together to form multiple coordinated views of the data. There are other coordinated views that provide the user with other aspects of the field.
100 Websites You Should Know and Use (updated!) In the spring of 2007, Julius Wiedemann, editor in charge at Taschen GmbH, gave a legendary TED University talk: an ultra-fast-moving ride through the “100 websites you should know and use.” Six years later, it remains one of the most viewed TED blog posts ever. Time for an update? We think so. Below, the 2013 edition of the 100 websites to put on your radar and in your browser. To see the original list, click here. And now, the original list from 2007, created by Julius Wiedemann, editor in charge at Taschen GmbH.
Pandoc - About pandoc 6 Gorgeous Facebook Visualizations Like every complex network, Facebook offers unlimited possibilities of visual representation of the various connections between its users. We've chosen six beautiful visualizations that will awaken the (visual) geek within you. You don't have to stop at merely watching. Some of the visualizations on the list come with tools that you can use to create beautiful Facebook visualizations of your own with very little effort. Enjoy! Know of a beautiful Facebook visualization? 1. This project visualizes all the data Facebook receives, on a global scale. 2. This wonderful illustration, created by Lee Byron from the Facebook data team, shows how Facebook has evolved from being a social network for universities to the global social networking powerhouse it is today, with over 200 million users. 3. Friend Wheel is a simple Facebook application that creates a radial graph out of all your Facebook friends. 4. 5. Still images really don't do justice to this one. 6.
101 Innovations in Scholarly Communication - Silk Tools on Datavisualization.ch A Carefully Selected List of Recommended Tools 07 May 2012 Tools Flash, JavaScript, Processing, R When I meet with people and talk about our work, I get asked a lot what technology we use to create interactive and dynamic data visualizations. Pathline: Connecting Designers With Scientists 18 Apr 2012 Tools We recently attended an interdisciplinary visualization workshop that was all about creating a dialogue between scientists, technologists and designers. New Maps for the Web by Stamen 22 Mar 2012 Tools JavaScript, Mapping I just left the Stamen studio where I had a brief chat with founder and CEO Eric Rodenbeck. The Visualizing Player 19 Jul 2011 Showcases, Tools Visualizing.org launched their brand new Visualizing Player, a terrific tool for embedding interactive and static data visualizations. Working with Data in Protovis 17 Feb 2011 Tools JavaScript, Tutorial The Google Books Ngram Viewer 21 Dec 2010 Tools BigData, DataMining, Research Polymaps 24 Aug 2010 Tools JavaScript, Mapping
Dual impact of research; towards the impactelligent university Meerkat | AICML Fact Sheet Meerkat is a social network analysis application under development by Dr. Osmar Zaiane and his lab. It offers facilities for automated community mining, various layout algorithms for helpful visualizations, and timeframe event analysis for dynamic networks that have been observed at multiple points in time. For Meerkat ED, click here. If links do not work, try a short time later, or contact us.Download Meerkat Lite (v1.002, 2011-11-04, for Windows, Ubuntu, OSX)RegistrationDownload Mailing (or request atmeerkat-join@mailman.srv.ualberta.ca) Questions and Comments? Demo Principal InvestigatorsDr. Note: Meerkat Lite has been developed to offer useful functionality, including many features not common to other SNA software. Social networks are ubiquitous. Features:
Journal of Statistical Software Exploration de données Un article de Wikipédia, l'encyclopédie libre. Vous lisez un « bon article ». L'utilisation industrielle ou opérationnelle de ce savoir dans le monde professionnel permet de résoudre des problèmes très divers, allant de la gestion de la relation client à la maintenance préventive, en passant par la détection de fraudes ou encore l'optimisation de sites web. C'est aussi le mode de travail du journalisme de données[1]. L'exploration de données[2] fait suite, dans l'escalade de l'exploitation des données de l'entreprise, à l'informatique décisionnelle. Histoire[modifier | modifier le code] Collecter les données, les analyser et les présenter au client. De 1919 à 1925, Ronald Fisher met au point l'analyse de la variance comme outil pour son projet d'inférence statistique médicale. L'arrivée progressive des micro-ordinateurs permet de généraliser facilement ces méthodes bayésiennes sans grever les coûts. Applications industrielles[modifier | modifier le code]
Publishing Group : science journals, jobs, and information