background preloader

CiteSpace: visualizing patterns and trends in scientific literature
CiteSpace: visualizing patterns and trends in scientific literature
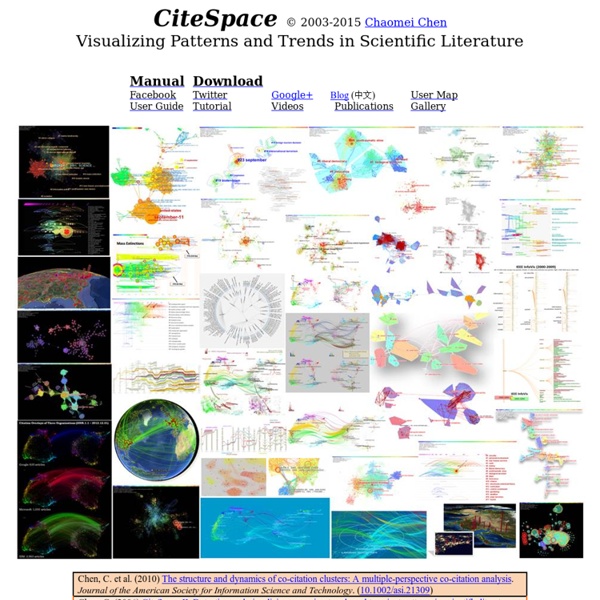
CiteSpace is a freely available Java application for visualizing and analyzing trends and patterns in scientific literature. It is designed as a tool for progressive knowledge domain visualization (Chen, 2004). It focuses on finding critical points in the development of a field or a domain, especially intellectual turning points and pivotal points. Detailed case studies are given in (Chen, 2006) and other publications. CiteSpace provides various functions to facilitate the understanding and interpretation of network patterns and historical patterns, including identifying the fast-growth topical areas, finding citation hotspots in the land of publications, decomposing a network into clusters, automatic labeling clusters with terms from citing articles, geospatial patterns of collaboration, and unique areas of international collaboration. The primary source of input data for CiteSpace is the Web of Science. Notes: You need to have Java Runtime installed on your computer. Yes. Disclaimer

mapequation.org Protovis Protovis composes custom views of data with simple marks such as bars and dots. Unlike low-level graphics libraries that quickly become tedious for visualization, Protovis defines marks through dynamic properties that encode data, allowing inheritance, scales and layouts to simplify construction. Protovis is free and open-source, provided under the BSD License. It uses JavaScript and SVG for web-native visualizations; no plugin required (though you will need a modern web browser)! Although programming experience is helpful, Protovis is mostly declarative and designed to be learned by example. Protovis is no longer under active development.The final release of Protovis was v3.3.1 (4.7 MB). This project was led by Mike Bostock and Jeff Heer of the Stanford Visualization Group, with significant help from Vadim Ogievetsky. Updates June 28, 2011 - Protovis is no longer under active development. September 17, 2010 - Release 3.3 is available on GitHub. May 28, 2010 - ZOMG! Getting Started

OSTComplet.pdf (Objet application/pdf) L'Observatoire des Sciences et des Techniques (OST) est un groupement d’intérêt public auquel participent quatre ministères (en charge de l'enseignement supérieur et la recherche, du redressement productif, de la défense et de l'écologie, du développement durable et de l'énergie), les principaux organismes de recherche (CEA, Cirad, Cnes, CNRS, Inra, Inria, Inserm, IRD, Irstea), la Conférence des Présidents d’Université (CPU) et l'Association nationale de la recherche et de la technologie (ANRT). Il a pour mission de concevoir et de produire des indicateurs et des analyses relatifs à la recherche et à l'innovation, pour éclairer les politiques publiques et les analyses stratégiques dans ce domaine. Voir la plaquette de présentation en version française et en version anglaise. Des besoins nouveaux en indicateurs accompagnent la globalisation des économies de la connaissance Les indicateurs constituent de puissants outils d'analyse et de pilotage des politiques publiques.

Projects - *ORA Overview | People | Sponsors | Publications | Hardware Requirements | Software | Training & Sample Data *ORA is a dynamic meta-network assessment and analysis tool developed by CASOS at Carnegie Mellon. It contains hundreds of social network, dynamic network metrics, trail metrics, procedures for grouping nodes, identifying local patterns, comparing and contrasting networks, groups, and individuals from a dynamic meta-network perspective. *ORA has been used to examine how networks change through space and time, contains procedures for moving back and forth between trail data (e.g. who was where when) and network data (who is connected to whom, who is connected to where …), and has a variety of geo-spatial network metrics, and change detection techniques. *ORA can handle multi-mode, multi-plex, multi-level networks. Based on network theory, social psychology, operations research, and management theory a series of measures of “criticality” have been developed at CMU.

Data mining Data Mining (рус. добыча данных, интеллектуальный анализ данных, глубинный анализ данных) — собирательное название, используемое для обозначения совокупности методов обнаружения в данных ранее неизвестных, нетривиальных, практически полезных и доступных интерпретации знаний, необходимых для принятия решений в различных сферах человеческой деятельности. Термин введён Григорием Пятецким-Шапиро в 1989 году[1][2][3]. Английское словосочетание «Data Mining» пока не имеет устоявшегося перевода на русский язык. При передаче на русском языке используются следующие словосочетания[4]: просев информации, добыча данных, извлечение данных, а, также, интеллектуальный анализ данных[5][6][7]. Более полным и точным является словосочетание «обнаружение знаний в базах данных» (англ. knowledge discovering in databases, KDD). Введение[править | править исходный текст] Исторический экскурс[править | править исходный текст] Постановка задачи[править | править исходный текст] Что означает «скрытые знания»?

Citations: Too Many, or Not Enough? - The Scientist - Magazine of the Life Sciences Citations: Too Many, or Not Enough? By William J. Pearce Citations: Too Many, or Not Enough? We are citing too many papers inappropriately. Citations: Too Many, or Not Enough? We are citing too many papers inappropriately. Students, colleagues and coauthors must critically read each paper cited in its entirety. For more than 100 years, before PubMed was freely accessible via the Internet, the medical literature was commonly accessed via Index Medicus, the first comprehensive index of journal articles available through the Library of Medicine. The introduction of PubMed in the mid-1990s revolutionized the process of finding and retrieving relevant literature. Other consequences of the trend toward less critical evaluation of cited literature include not only a gradual erosion of scholarly rigor, but also a dilution of the value of the impact factor as a measure of journal prominence. In the midst of this challenging environment for science publishing, what are the best options? William J.

Tulip Заглавная страница E-LIS - The rise and rise of citation analysis Pievatolo, Maria Chiara Stand up for your copyright: la prospettiva dell'autore., 2006 . In Dopo Berlin 3 : politiche di accesso aperto alla letteratura scientifica, Pisa (Italy), 16 February 2006. [Presentation] English abstract Presentation about copyright and scentific authors. Presentation held at the workshop : "Dopo Berlin 3: politiche di accesso aperto alla letteratura scientifica" (University of Pisa, 16 febbraio 2006). Italian abstract Oggi i diritti d'autore vengono per lo più valorizzati e impiegati come diritti dell'editore.

Cytoscape: An Open Source Platform for Complex Network Analysis and Visualization Information Visualization Database 1991 computer graphics (XGvis) by Andreas Buja, Deborah F. Swayne, Michael L. Littman, Nathaniel Dean From 1991 to 1996, there was a spate of development and public distribution of highly interactive systems for data analysis and visualization, e.g., XGobi, ViSta by Deborah Swayne, Di Cook, Andreas Buja, and Forrest Young (1940-2006). Buja, A., Asimov, D., Hurley, C., and McDonald, J. Swayne, D. Buja, A., Cook, D., and Swayne, D. Swayne, D. Young, F.

Related: