

A Free Web & Mobile App for Reading Comfortably Sprachlich Diese Seiten sind die Nachfolgeversion der “gelben Site“, auf der vor allem Linklisten zu so unterschiedlichen Themen wie Deutsch als Fremdsprache, Computerlinguistik, Literaturzusammenfassungen, Geschichtsdidaktik und Jugendarbeit versammelt waren. Im Moment (Sommer 2012) bin ich immer noch dabei, ausgewählte Inhalte von der alten Seite in dieses Projekt zu übernehmen bzw. zu überarbeiten. Was in welcher Form übernommen wird und was überhaupt nicht, ist im Moment noch nicht klar. Die alte Einstiegsseite mit den alten Inhalten ist aber immer noch erreichbar. Schon relativ weit fortgeschritten sind die Bereiche Das DaF-Blog ist natürlich auch immer noch in Betrieb . Anmerkungen:
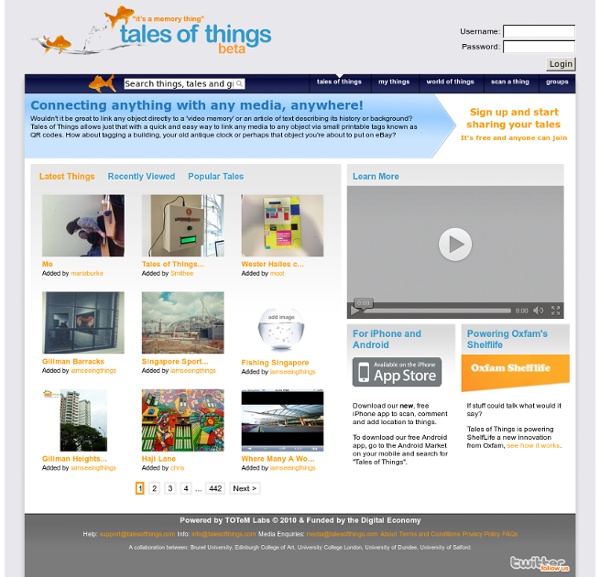
eBook Details : Palgrave Connect Every object tells a story. Depending on just how ‘talkative’ a thing is, or how it relates to other objects we know, it might tell us about its origins, design, consistency, uses, or monetary value. Some objects are deemed more significant (and expensive) than others – because they are old or rare, used to belong to an important person, or are emblematic of a nation’s culture and history (Leder Mackley et al., 2010). Yet, there are also idiosyncratic, affective stories behind physical objects’ places in ordinary people’s homes and hearts. This is because some objects hold and evoke personal memories. They remind us of people, places, times and feelings, of who we are, who we used to be, and who we aspire to become (Miller, 2008). This chapter is part of the interdisciplinary pan-UK research project TOTeM (Tales of Things and Electronic Memory).
Five Ways to Visually Explore Wikipedia Wikipedia is one of the first places that students often go to get some background information on a topic they're researching. Besides just going to Wikipedia.org and entering a search, there are some other ways to explore the content of Wikipedia. Here are five ways that students can visually explore Wikipedia's content. Wiki Mind Map is a resource for visually exploring Wikipedia. Wikihood is a neat way to explore the world in your web browser. Wiki Field Trip is a neat website for exploring Wikipedia entries about places around the world. The Full Wiki offers an interesting mash-up of Google Maps and Wikipedia entries. One of the standard layers in Google Earth is the Wikipedia layer.
dafdiesunddas | Deutsch lehren, lernen und weiterkommen WHICH 50 : Tumblr is different — and its business model can celebrate this difference. Tumblr’s audience is young, affluent, engaged — and different. It is also worth a billion dollars to Yahoo!, assuming the company can translate its community’s enthusiasm into commerce at scale. Much has been made of Tumblr’s relatively nascent advertising business and too much has probably been made of all that adult content; after all, it’s not like Google, YouTube, Pinterest and Twitter are TSFW. What is missing from the current analysis is the opportunity for Tumblr — which is still only an adolescent relative to other social networks — to build an ecosystem based on transactional commerce . (Source: A Tumblr Snapshot Source: globalwebindex.net. There are no markets around the world where Tumblr’s active user base exceeds ten per cent of the Internet population, for instance. So the opportunity is there for the taking, and the first movers are already evolving into their second iterations. He told Which-50 “We learned a massive amount from our first evolution of the platform.”
Zoom.it Angenehm Deutsch | Deutsch lernen und lehren Das Gedicht im Juli Hoffmann von FallerslebenWie freu’ ich mich der Sommerwonne! Wie freu’ ich mich der Sommerwonne, Des frischen Grüns in Feld und Wald, Wenn’s lebt und webt im Glanz der Sonne Und wenn’s von allen Zweigen schallt! Ich möchte jedes Blümchen fragen: Hast du nicht einen Gruß für mich? Die Welt ist mein, ich fühl es wieder: Wer wollte sich nicht ihrer freu’n, Wenn er durch frohe Frühlingslieder Sich seine Jugend kann erneu’n? Kein Sehnen zieht mich in die Ferne, Kein Hoffen lohnet mich mit Schmerz; Da wo ich bin, da bin ich gerne, Denn meine Heimat ist mein Herz. Das Juni – Gedicht August Heinrich Hoffmann von Fallersleben Beim Regen Liebe Sonne, scheine wieder, Schein’ die düstern Wolken nieder! Trockne ab auf allen Wegen Überall den alten Regen! Das Mai – Gedicht Ludwig Heinrich Christoph Hölty Frühlingslied Die Luft ist blau, das Tal ist grün, die kleinen Maienglocken blühn und Schlüsselblumen drunter; der Wiesengrund ist schon so bunt und malt sich täglich bunter. Erich Kästner
Story of My Life.com - Write and preserve your life stories forever America: A Narrative History, 8e: W. W. Norton StudySpace US History Tours powered by Google Earth. This new format traces historical developments across time, touching down on locations vital to our nation's heritage and development. Points of interest in each tour launch primary and multimedia sources. Download Tours: To download: Windows users: right-click, "save link as"; Mac users: ctrl+click, "save as". If you haven’t done it already, download Google Earth™ and install it on your computer.
DEUTSCH-PORTAL.COM - Deutsch als Fremdsprache. Weltweit besser lernen. World Digital Library Home LehrerRaum | Fur die Menschen, die Deutsch perfekt unterrrichten mochten Stats about all US cities - real estate, relocation info, house prices, home value estimator, recent sales, cost of living, crime, race, income, photos, education, maps, weather, houses, schools, neighborhoods, and more