Humble software development - HumbleFinance Financial Graphs
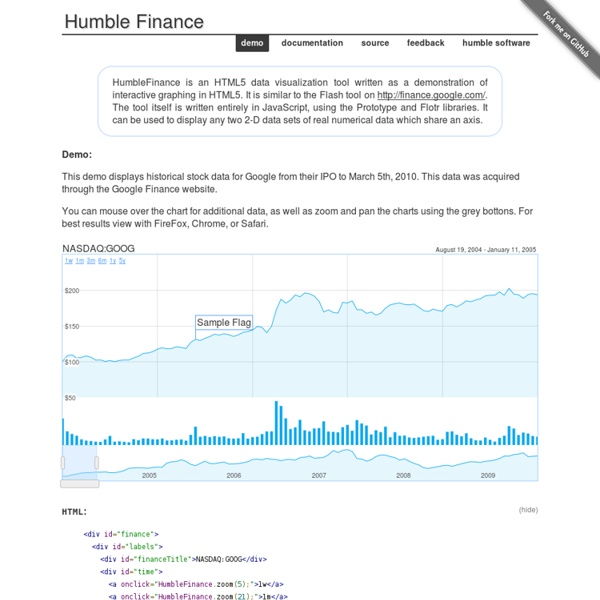
HumbleFinance is an HTML5 data visualization tool written as a demonstration of interactive graphing in HTML5. It is similar to the Flash tool on The tool itself is written entirely in JavaScript, using the Prototype and Flotr libraries. Demo: This demo displays historical stock data for Google from their IPO to March 5th, 2010. You can mouse over the chart for additional data, as well as zoom and pan the charts using the grey bottons. August 19, 2004 - January 11, 2005 HTML: (hide) <div id="finance"><div id="labels"><div id="financeTitle">NASDAQ:GOOG</div><div id="time"><a onclick="HumbleFinance.zoom(5);">1w</a><a onclick="HumbleFinance.zoom(21);">1m</a><a onclick="HumbleFinance.zoom(65);">3m</a><a onclick="HumbleFinance.zoom(127);">6m</a><a onclick="HumbleFinance.zoom(254);">1y</a><a onclick="HumbleFinance.zoom(1265);">5y</a></div><div id="dateRange"></div></div></div> demo.js: (hide)
Update to jQuery Visualize: Accessible Charts with HTML5 from Designing with Progressive Enhancement
Posted by Maggie on 03/12/2010 Topics: accessibility dwpe book jQuery progressive enhancement A while ago, we came up with a technique for creating accessible charts and graphs that uses JavaScript to scrape data from an HTML table and generate bar, line, area, and pie chart visualizations using the HTML5 canvas element. We've updated the Visualize plugin — adding ARIA attributes to clarify the chart's role to screen reader users, so they're better informed about which elements contain useful data; and providing two style variations to demonstrate how you can use CSS to customize the charts' appearance. Visualize is one of the 12 fully-accessible, project-ready, progressive enhancement-driven widgets that accompanies our new book, Designing with Progressive Enhancement. How the Visualize plugin works The Visualize plugin parses key content elements in a well-structured HTML table, and leverages that native HTML5 canvas drawing ability to transform them into a chart or graph visualization.
RGraph: HTML5 canvas graph library based on the HTML5 canvas tag
Raphaël—JavaScript Library
8393)
Easy Graphs with Google Chart Tools
Google Chart Tools provide several ways to easily add charts to any web page. Charts may be static or interactive, and in this tutorial, we'll learn how to use both of them. There are two different types of graphs that Chart Tools can generate: image charts (static graphs) and interactive charts. Image Charts.- Use the Google Chart API.Interactive Charts.- Use the Google Visualization API. Image Charts are quite easy to use, however, interactive charts are far more flexible, because they can trigger events which we can use to interact with other elements in the page. Yes, there is a super-easy way to include a chart in your page - as easy as writing a URL like this: if you copy and paste this url in your browser, you'll see the following: You can place the image anywhere in your page using the URL as the src attribute of an image tag: That's the Google Charts API. This is the base URL; we'll use it for all image chart requests. cht=p3 This is the chart type.
jQuery Sparklines
News 15 June 2013 - Version 2.1.2 Relased This release adds support for jQuery 1.10.0 and other bug fixes and minor improvements. See the full changelog for details of all changes. 26 January 2013 - Version 2.1.1 Relased This release adds support for jQuery 1.9.0 along with a couple of other bug fixes. If you're using a version of jQuery later than 1.8, be extra sure you're not rendering your page in quirks mode to avoid breaking tooltips for IE users. See the full changelog for details of all changes. 15 October 2012 - Version 2.1 Released This release is primarily a bug-fix release, but also adds support for Internet Explorer 10. See the full changelog for details of all changes. 29 April 2012 - Version 2.0 Released This release represents a significant code update. Customizable mouseover tooltips and interaction including highlighting of moused-over values. It should be fully backwards compatible with the 1.x versions with the following exceptions: There's a few non-code updates as well: eg.
Gapminder: Unveiling the beauty of statistics for a fact based world view.
Related:
Related: