
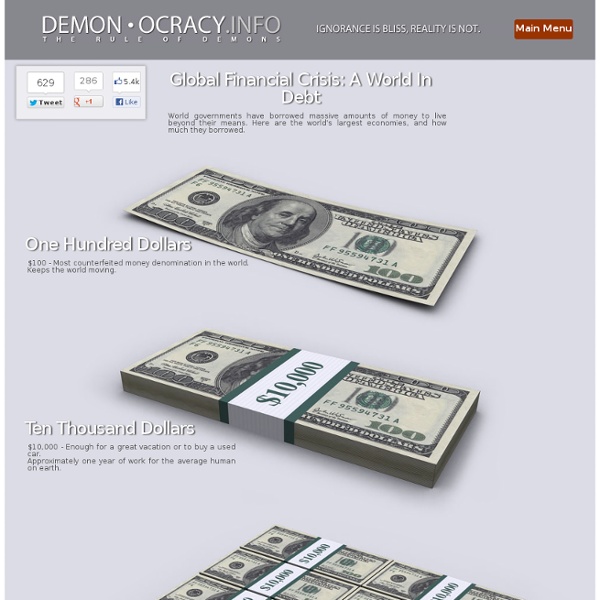
How Star Wars Changed the World Hopefully reading this infographic will give you a nice break, writing about it has for me. I sit here amidst a slew of homework, from writing a paper on Rousseau and his Discourses to studying Chinese Politics. Now after finding this infographic, all I want to do is put everything away and watch Star Wars. Whether you are a fan of the double triology (? Not to lead you on, but this infographic is not so much about the story/plot of Star Wars. Click to enlarge Share This Infographic Get Free Infographics Delivered to your Inbox Infographics James Bond may be the world's coolest secret agent killing super villains and saving hot babes all while cruising around in his fully modified Aston Martin that he seems to… Everyone has their favorite characters from DC and Marvel and may have even duked it out them out in Street Fighter style Marvel vs DC fighting games but how well… The SOPA bill that threatened to destroy the internet has finally be taken down after a long period of protesting. Just what exactly did it take to make Congress finally… Miss the State of the Union address yesterday or just want to review some of the highlights? I love Big Macs. Think airline services are bad enough and they're just out to get your money? Facebook is the biggest social network in the world. Technology can be a great ally for education -- but how big is its role in the learning process? We often think that scientists are the most honest people around, and assume that scientific findings are reliable and true.
The Quest to Power Africa More Infographics on Good 60 Seconds - Things That Happen On Internet Every Sixty Seconds World Wide Web is growing at rapid pace. On average, more than a billion new pages are added to it every day. To give you an idea of how big world wide web is, our Infographic 60 Seconds will cover some really interesting facts about websites that we use on day-to-day basis. Please Check - Things That Happen Every Sixty Seconds Part 2 Infographic by- GO-Globe.com To Publish this Image on your Blog or Website . <a href=" alt="60 Seconds - Things That Happen On Internet Every Sixty Seconds" src=" width="580" /></a><br /><strong>Infographic by- <a href=" Did You Know That – In 60 SECONDS Search engine Google serves more that 694,445 queries 6,600+ pictures are uploaded on Flickr 600 videos are uploaded on YouTube videos, amounting to 25+ hours of content 70 New domains are registered
Plus de 800 infographies sur le thème du web et de ses usages En une seule minute, une quantité monstrueuse de données est échangée sur le web. Chaque minute de chaque heure de chaque journée. L’agence... Lorsque l’on parle de Google, Samsung ou encore Apple, on ne peut qu’avoir les yeux qui brillent quand aux montants qu’ils annoncent.... Le cloud computing est annoncé comme la technologie de demain pour tous les avantages qu’on lui connait. Vous êtes une entreprise et vous souhaitez vous lancer comme vos amis dans les réseaux sociaux. Les réseaux sociaux sont addictifs et personne ne peut dire le contraire. Nous lisons de plus en plus et notamment en ligne. Foursquare est sans contest le réseau social de géolocalisation, leader sur son marché. Cette infographie présente les éléments composant un design de site web sur lesquelles jouent les web designer pour créer un site au design inédit.... Vous vous êtes toujours demandé ce à quoi ressemble ou ressemblait une chambre de geek?
40 Useful and Creative Infographics Six Revisions Menu Main Categories CSS HTML JavaScript Web Design WordPress Web Development Design Inspiration UX Design UI Design Freebies Tutorials Tools Links About Contact Advertise RSS Twitter Facebook 40 Useful and Creative Infographics By Jacob Gube Information graphics (or infographics) are graphical depictions of data and information. In this collection, you’ll find forty beautiful and educational infographics, displaying the uncommon spectacle of "art meets science". 1. The proportion of ingredients for popular coffee drinks and their pronunciation keys. 2. This infographic showcases the history of the Swine Flu, starting from 1976. 3. 4. 5. The top breweries and beers in the U.S. 6. 7. 389 Years Ago A rundown of the historic events in African-American culture. 8. 9. 10. 11. An illustrated guide at how the Global Warming phenomenon works. 13. A packed visual piece on tobacco chemicals and tobacco trade worldwide. 14. 15. 16. A graphical representation of consumer spending across the globe. 17.
10 Outstanding Social Media Infographics Nobody has time to read anymore, right? Every day we are all inundated with more and more information overload coming from credible and yet to be verified sources. Where can Internet users find relief? Answer: the infographic. Infographics are a wonderful mix of key data and visualization that can really bring the message home if put together correctly. Update: Check out our infographic design services 1 – World Map of Social Networks Let’s start at the 50,000 foot view, shall we? (Source) 2 – Age Distribution on Social Network Sites Is age distribution targeting more your thing? (Source) 3 – Social Media Periodic Table of Elements As we previously reported, our friend and fellow Advertising Age Power 150 member Eyecube created another great visualization called the social media periodic table of elements: (Source) 4 – The Conversation Prism No social media infographic collection would be complete without Brian Solis’ Conversation Prism: 5 – The Boom of Social Sites (Source) (Source) (Source)
The Facts and Figures about the Power of Visual Content - Infographic We all know that images are compelling. The growth of visual content has been on a rapid upward trajectory over the last 12 months. Social media platforms such as Pinterest and Instagram have taken the social media world by storm. Instagram announced in July that it had acquired 80 million users. Compete.com recently released a report showing that Instagram was the fastest growing web property on the planet amongst the top 50 websites. Simply Measured looked at Facebook’s top 10 brand pages to find out the real numbers and facts and figures on the engagement and sharing levels of photos and videos in comparison to text and discovered: Videos are shared 1,200 percent more than links and text posts combinedPhotos are liked 200% more than text updates To put some perspective on the power of visual content other studies show that Photo and video posts on Pinterest are referring more traffic than Twitter, Stumbleupon, LinkedIn and Google+. It is now available on Amazon. Image by Big Stock Photo
Infographics | News | Design | Arts | Tech | Entertainment | Latest News | The Skunk Pot What are your resolutions? Infographic 2013 is drawing to an end. New Year’s Eve celebration trends. What are your plans for the great night of tomorrow? Create the perfect Instagram photo The holiday season is a great period to fill up your Instagram account with pictures of Christmas trees, traditional holiday food, Christmas decorations, New Year’s Eve party dresses, glitter and sparkles, presents, Santa Claus and so on. The best glasses for your face type. Once an year draws to an end, we start thinking about the next one and start making some plans. Career tips from Rudoplh. It’s Christmas and you’re probably at home, bundled up in blankets and enjoying some time off. How we waste time at work It is very likely that you are reading this very blog post at work. Most popular toys Christmas is on the way, do you feel the rush? Be more productive. December does not only mean Christmas trees, holiday plans or happy winter songs. Getting ready for Christmas?