background preloader

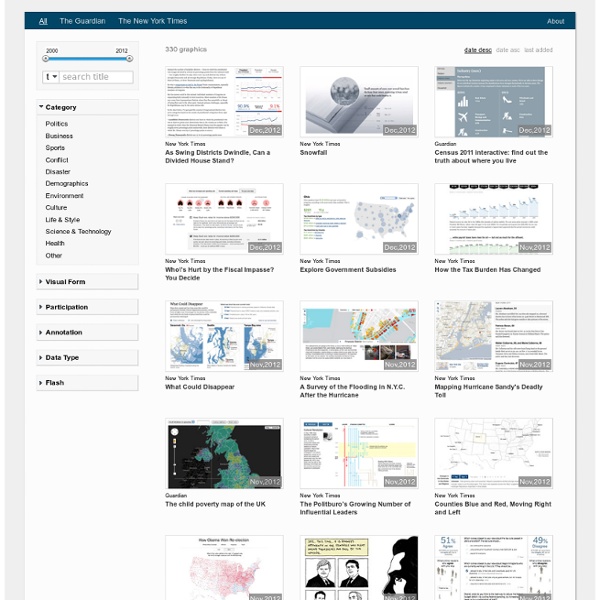
Interactive News Graphics

Interactive News Graphics

Free forum : OPPT Court Cases Gregor Aisch – driven by data 7 Amazing Interactive Infographics Created With HTML, CSS and Javascript Infographics (Information graphics) are graphic visual representations of information, data or knowledge. These graphics able to let us absorb the information in an effective way. In real life, we can easily find some in our surrounding, for example, maps, train route, signs and so on. On the internet, we can find heaps of well-designed and educational infographics, on Queness, we also featured a few and including a post about how to make one: However, in this post, we are not going to feature the common static and image based infographics. Is the Internet Awake? Educate-Yourself.org:The Freedom of Knowledge; The Power of Thought Open Book Publishers launches new Digital Humanities Series » aaDH: Australasian Association for Digital Humanities Open Book Publishers has launched a new Digital Humanities Series . The series is overseen by an international board of experts (including two members of the aa-DH inaugural executive committee) and its books subjected to rigorous peer review. Its objective is to encourage works that extend the boundaries of the field and help to strengthen its interrelations with the other disciplines of the arts, humanities and beyond. We are interested in experimental monographs, edited volumes and collections as well as introductory guides for non-specialists, best practices guides for practitioners and “state of the art” surveys. The Series offers digital humanists a dedicated venue for high-quality, Open Access publication. Proposals in any area of the Digital Humanities are invited. Editorial Board: Paul Arthur, Kathleen Fitzpatrick, Julia Flanders, Gary Hall, Brett D.

50 Great Examples of Data Visualization Wrapping your brain around data online can be challenging, especially when dealing with huge volumes of information. And trying to find related content can also be difficult, depending on what data you’re looking for. But data visualizations can make all of that much easier, allowing you to see the concepts that you’re learning about in a more interesting, and often more useful manner. Below are 50 of the best data visualizations and tools for creating your own visualizations out there, covering everything from Digg activity to network connectivity to what’s currently happening on Twitter. Music, Movies and Other Media Narratives 2.0 visualizes music. Liveplasma is a music and movie visualization app that aims to help you discover other musicians or movies you might enjoy. Tuneglue is another music visualization service. MusicMap is similar to TuneGlue in its interface, but seems slightly more intuitive. Digg, Twitter, Delicious, and Flickr Internet Visualizations

Search Engine & Alphabetical Directory Ellie's World Blogs 2016 2015 2014 2013 2012 2011 2010 2009 2008 2007 2006 2005 2004 2003 2002 2001 2000 Archived Stories and Articles, Healing and Awareness, More Ellie's Biography Ellie's World Daily Blog Ezine: Crystalinks Daily Blog Crystalinks' Mission Statement 11:11 - Encoded Digital Messages 12 Around 1 Geometry of Creation12 Days of Magic12 Fibonacci Goddesses12 Pyramids of Thoth12 Strand DNA 12 Tablets - Lunar Journey The Lost Tablets 2000 - Ellie's Trip to Egypt2001 A Space Odyssey - This Spake Zarathustra2012 - Mayan Calendar Prophecy3, 2, 1, Countdown, Sequential Digital Triggers36 Around 1414440444 555666 Mark of the Beast90 Degrees of Separation9/11 Aboriginal PeopleAcupressureAcupunctureADD & ADHDAffirmations - Thinking PositivelyAgartha - Hollow EarthAgeismAgingAgricultureAjanta Caves Akashic RecordsAkhenatenAkkadia Alchemy Index Ancient and Lost CivilizationsAncient Alien Theory - Ancient AstronautsAncient Flying Vehicles, VimanasAncient MedicineAncients Animals IshtarIsis

Crowdsourcing For Humanities Research

Related: