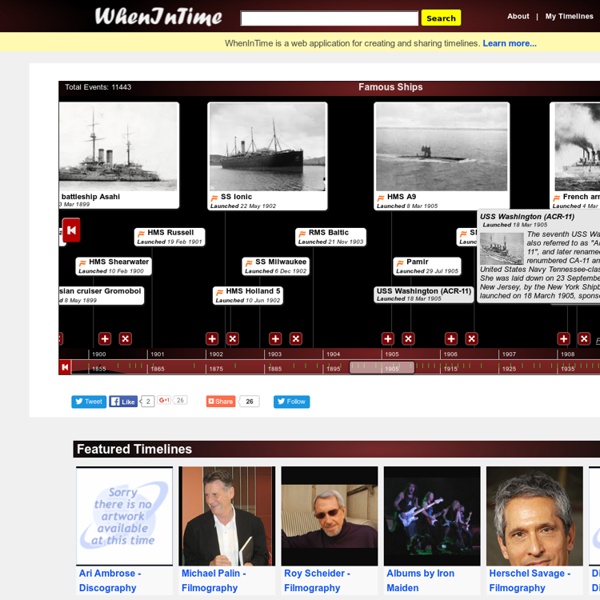


Beautiful web-based timeline software Timeline JS3 Virtuella utflykter Med stöd av läroplanen kan vi idag göra virtuella utflykter. Läroplanen förespråkar till och med att vi använder digital teknik för att förstå och göra oss förstådda och som hjälpmedel i lärandet. Källkritiken och att kunna googla är viktiga ingredienser samtidigt som vi ska jobba med kulturer och att jämföra upplevelser med egna landet med hur det är i andra länder. Här kommer jag tipsa om diverse olika sidor för att arbeta med virutella utflykter. En sida som listar platser att besöka i alfabetisk ordning är denna. Om du vill kika in på världens sju underverk finns denna danska sida. Så här kan det t ex se ut på Skansen vid midsommar i Sverige. Här finns flera hundratals panoramabilder. Google har många sidor, bl a World Wonders, Google Earth , Google Moon , Google Map. Om du vill besöka ett Zoo finns denna sida att använda och där finns även material för att lära mer om djuren på engelska. Du kan även besöka Vita Huset.
User Experience Online Courses | Interaction Design Foundation As a member, you can take as many courses as you want with no additional costs. This means you only have to pay our membership fee to take an unlimited number of courses. There are no further charges on top of the membership fee. Start Learning Yes, you can take as many courses as you would like. There are no further charges once you have paid for your membership. Please note: If you have a student membership, you can take a maximum of three courses at the same time. Here is how to get your manager or company to pay for your membership: Get approval from your manager (e.g. using the email template below). Dear manager, I would like to get reimbursement for my membership of the Interaction Design Foundation (IDF). I can enroll in all the IDF’s self-paced, online courses (in my spare time), which will help me complete current projects with a better result. Don't worry if you missed the course.
Cube Time Series Data Collection & Analysis Cube is a system for collecting timestamped events and deriving metrics. By collecting events rather than metrics, Cube lets you compute aggregate statistics post hoc. Collecting Data An event in Cube is simply a JSON object with a type, time, and arbitrary data. Cube’s collector receives events and saves them to MongoDB. Querying Events Cube defines a simple language for querying events. You can intersect filters and customize which event fields are returned. request(browser).gt(duration, 250).lt(duration, 500) Cube supports both HTTP GET and WebSockets for retrieving events. Querying Metrics You can also use Cube to group events by time, map to derived values, and reduce to aggregate metrics. The first few results of which appear as: Or, to count requests to the path "/search", change the expression: sum(request.eq(path, "/search")) sum(request(duration)) Want to learn more?
VanGoYourself | Recreate artworks with your friends yEd - Graph Editor “ As a software developer, I used to use Graphviz for my code comprehension needs. While its compact format has its advantages, it was just too much effort to input data - particularly relationships. I wanted to be able to create relationships by dragging my mouse from one node to another. Appar som hjälpmedel | autismnvskane Här följer ett urval av iOS-appar (iPad, iPhone, iPod) i några olika kategorier. Listan kommer att uppdateras då och då framöver. – Dexteria: Handmotorik – Teckna: TeckenHattens teckensamling med filmer. – TeckenLex: teckensamling med filmer. – Ritade tecken: SPMI:s tecken från Ebba Editor. Kommunicera med bildkartor: – Grace Picture exchange for non-verbal people: PECS-app utan talsyntes. – Pratkort: Svensk app med 500 bilder. – Tap Speak Choice: Svensk talsyntes och PCS-bilder medföljer(dock på eng). – GoTalk Now: Talapparaten nu som app. – Grid Player: Kommer i mars till App Store som iPad app och senare även för iPhone/iPod. Kommunicera med situationsbilder: – Scen Speak: Lägg till tal eller ljud till ”hotspots” i egna importerade bilder. – Scene & Heard: Lägg till nyckelord med bild och tal i anslutning till egna bilder. Övrigt – Pictogram: bildsamling med pictogram. – First Then – Visual Schedule Planner – Schedular: Videoscheman eller bildscheman. – Home Routine: Endast text. – Picture Planner
Sketch App Sources - Free graphical resources - Sketch Freebie - Free Sketch Files and SVG Files for Sketch 3 software