If the world’s population lived like…
Shortly after I started Per Square Mile, I produced an infographic that showed how big a city would have to be to house the world’s 7 billion people. There was a wrinkle, though—the city’s limits changed drastically depending on which real city it was modeled after. If we all lived like New Yorkers, for example, 7 billion people could fit into Texas. If we lived like Houstonians, though, we’d occupy much of the conterminous United States. Here’s that infographic one more time, in case you haven’t seen it: What’s missing from it is the land that it takes to support such a city. It turns out that question is maddeningly difficult to answer. But what we can do is compare different countries and how many resources their people—and their lifestyles—use. Sources: Global Footprint Network. 2011. Wackernagel, M., Kitzes, J., Moran, D., Goldfinger, S. & Thomas, M. (2006). Related posts: If the world’s population lived in one city… 7 billion Spare or share?
DNA Sequencing Costs
DNA Sequencing Costs Data from the NHGRI Genome Sequencing Program (GSP) Overview For many years, the National Human Genome Research Institute (NHGRI) has tracked the costs associated with DNA sequencing performed at the sequencing centers funded by the Institute. The cost-accounting data presented here are summarized relative to two metrics: (1) "Cost per Megabase of DNA Sequence" - the cost of determining one megabase (Mb; a million bases) of DNA sequence of a specified quality [see below]; (2) "Cost per Genome" - the cost of sequencing a human-sized genome. To illustrate the nature of the reductions in DNA sequencing costs, each graph also shows hypothetical data reflecting Moore's Law, which describes a long-term trend in the computer hardware industry that involves the doubling of 'compute power' every two years (See: Moore's Law [wikipedia.org]). These data, however, do not capture all of the costs associated with the NHGRI Large-Scale Genome Sequencing Program. Cost Categories
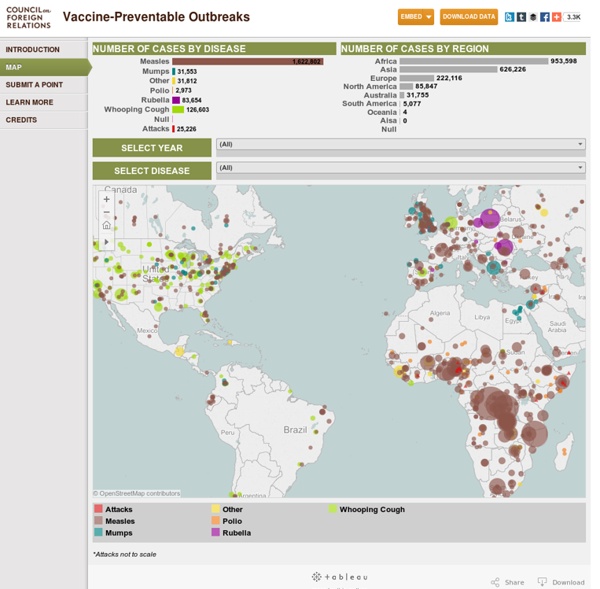
Contagious Disease Surveillance | Virus Awareness | Flu Map | HealthMap
Income inequality, as seen from space
Last week, I wrote about how urban trees—or the lack thereof—can reveal income inequality. After writing that article, I was curious, could I actually see income inequality from space? It turned out to be easier than I expected. Below are satellite images from Google Earth that show two neighborhoods from a selection of cities around the world. Rio de Janeiro Rocinha Zona Sul Oakland West Oakland Piedmont Houston Fourth Ward River Oaks Chicago Woodlawn Hyde Park Beijing Fengtai Chaoyang Boston metro area, Massachusetts Ball Square, Somerville West Cambridge Your examples Do you have other cities or neighborhoods in mind? Be sure to include the names of the cities and neighborhoods you’re highlighting and if you’d like me to mention your name. Your examples are now posted! Related posts: Urban trees reveal income inequality Income inequality in the Roman Empire Ghosts of geography
Flightradar24.com - Live flight tracker!
In order to save data consumption Flightradar24 web page times out after 30 minutes. Please reload the web page to get another 30 minutes. or get a Flightradar24 Premium subscription and Flightradar24.com will not time-out again!
Are the Richest Americans Also the Best Educated?
More Infographics on Good
Patents: A beginner's guide to intellectual property
Like many specialist subjects the world of patent litigation is chock-full of acronyms and jargon. The following glossary should help make sense of what some of the key terms mean: Abandonment The person applying for the patent may decide to give up on the process before their filing is approved. If they fail to respond to a request from a patent office for more information within a set time limit, fail to pay related fees or write in to cancel their application, patent office officials can judge it to be abandoned. Abstract A brief summary of the invention providing technical information about it, both as an overview for readers as well as to help make it easy to find via searches. Application To be granted a patent the author must first file a specification describing their invention, the draft patent claims sought, an abstract and any relevant illustrations. Claims These are the heart of a patent application. Copyright Damages Defensive patent aggregator (DPA) Description Evergreening Frand
Cartography: The true true size of Africa
LAST month Kai Krause, a computer-graphics guru, caused a stir with a map entitled "The True Size of Africa", which showed the outlines of other countries crammed into the outline of the African continent. His aim was to make "a small contribution in the fight against rampant Immappancy"—in particular, the fact that most people do not realise how much the ubiquitous Mercator projection distorts the relative sizes of countries. A sphere cannot be represented on a flat plane without distortion, which means all map projections distort in one way or another. Some projections show areas accurately but distort distances or scales, for example; others preserve the shapes of countries but misrepresent their areas. You can read all the gory details on Wikipedia. Gerardus Mercator's projection, published in 1569, was immediately useful because it depicts a line of constant bearing as a straight line, which is handy for marine navigation.