
Birds, bees, and banks: lessons from collapsing ecosystems Figuring out why financial crises emerge in seemingly stable economies is tough. Widespread collapses are notoriously difficult to predict - to do so requires a comprehensive view of a complex, interconnected system. But help may be at hand: experts in finance are now looking to certain fields of ecology to help provide this viewpoint. Ecologists have long been concerned with how connections between species relate to the overall stability of an ecosystem. Rather than focus on an individual species, some use a powerful branch of mathematics called network theory to map out a web of interaction. These networks can then be compared to one another to provide insights into how an ecosystem might cope with external shocks. For example, in the 1940’s a drought-resistant plant native to Africa and Asia known as Buffelgrass was introduced to the south-west America’s Sonoran Desert as a means of feeding cattle. This snowballing cycle can be seen in financial crises as well.
Xulvi-Brunet–Sokolov algorithm Xulvi-Brunet and Sokolov's algorithm generates networks with chosen degree correlations. This method is based on link rewiring, in which the desired degree is governed by parameter ρ. By varying this single parameter it is possible to generate networks from random (when ρ = 0) to perfectly assortative or disassortative (when ρ = 1). This algorithm allows to keep network's degree distribution unchanged when changing the value of ρ.[1] Assortative model[edit] In assortative networks, well-connected nodes are likely to be connected to other highly connected nodes. The Xulvi-Brunet–Sokolov algorithm for this type of networks is the following. Disassortative model[edit] In disassortative networks, highly connected nodes tend to connect to less-well-connected nodes with larger probability than in uncorrelated networks. The Xulvi-Brunet and Sokolov's algorithm for this type of networks is similar to the one for assortative networks with one minor change. References[edit]
Network tomography Network tomography is the study of a network's internal characteristics using information derived from end point data. The word tomography is used to link the field, in concept, to other processes that infer the internal characteristics of an object from external observation, as is done in MRI or PET scanning (even though the term tomography strictly refers to imaging by slicing). The field is a recent development in electrical engineering and computer science, dating from 1996.[1] Network tomography seeks to map the path data takes through the Internet by examining information from “edge nodes,” the computers in which the data are originated and from which they are requested. The field is useful for engineers attempting to develop more efficient computer networks. Data derived from network tomography studies can be used to increase quality of service by limiting link packet loss and increasing routing optimization. Recent developments[edit] Loss tomography[edit] Delay tomography[edit]
New Bacterial Life-Form Discovered in NASA and ESA Spacecraft Clean Rooms High atop a platform inside a clean room at the European Space Agency’s (ESA) launch site in South America, scientists painstakingly searched for microbes near the Ariane 5 rocket due to launch the Herschel space telescope in May 2009. Only very unusual organisms can survive the repeated sterilization procedures in clean rooms, not to mention the severe lack of nutrients available. But the scientists’ careful inspection was fruitful, turning up a type of bacteria that had been seen only once before. Two years earlier this same bug had surfaced 4,000 kilometers away in the clean room at NASA’s Kennedy Space Center in Florida where engineers were preparing the Mars lander Phoenix for launch. The researchers named the bacterium Tersicoccus phoenicis. Scientists go to all this trouble for the purpose of “planetary protection”—which usually means protecting other planets from contamination by microbes originating on Earth.
Widest path problem Path-finding using high-weight graph edges A closely related problem, the minimax path problem or bottleneck shortest path problem asks for the path that minimizes the maximum weight of any of its edges. It has applications that include transportation planning.[7] Any algorithm for the widest path problem can be transformed into an algorithm for the minimax path problem, or vice versa, by reversing the sense of all the weight comparisons performed by the algorithm, or equivalently by replacing every edge weight by its negation. Undirected graphs[edit] In an undirected graph, a widest path may be found as the path between the two vertices in the maximum spanning tree of the graph, and a minimax path may be found as the path between the two vertices in the minimum spanning tree.[8][9][10] Fernández, Garfinkel & Arbiol (1998) use undirected bottleneck shortest paths in order to form composite aerial photographs that combine multiple images of overlapping areas. Directed graphs[edit]
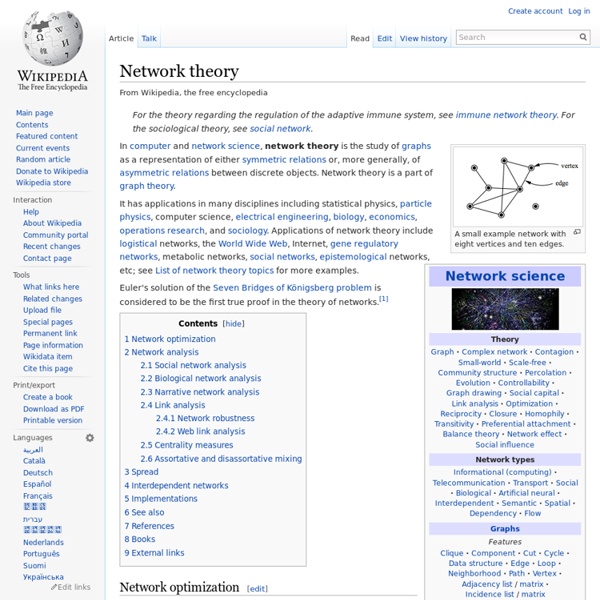
Network science Academic field Network science is an academic field which studies complex networks such as telecommunication networks, computer networks, biological networks, cognitive and semantic networks, and social networks, considering distinct elements or actors represented by nodes (or vertices) and the connections between the elements or actors as links (or edges). The field draws on theories and methods including graph theory from mathematics, statistical mechanics from physics, data mining and information visualization from computer science, inferential modeling from statistics, and social structure from sociology. The United States National Research Council defines network science as "the study of network representations of physical, biological, and social phenomena leading to predictive models of these phenomena."[1] Background and history[edit] The study of networks has emerged in diverse disciplines as a means of analyzing complex relational data. Department of Defense initiatives[edit] . .
21 Science Fictions That Became Science Facts In 2013 Weighted planar stochastic lattice Starting with a square, say of unit area, and dividing randomly at each step only one block, after picking it preferentially with respect to ares, into four smaller blocks creates weighted planar stochastic lattice (WPSL). Essentially it is a disordered planar lattice as its block size and their coordination number are random. Description[edit] Regular planar lattices like square lattices, triangular lattices, honeycomb lattices, etc., are the simplest example of the cellular structure in which every cell has exactly the same size and the same coordination number. The planar Voronoi diagram, on the other hand, has neither a fixed cell size nor a fixed coordination number. Its coordination number distribution is rather Poissonian in nature.[5] That is, the distribution is peaked about the mean where it is almost impossible to find cells which have significantly higher or fewer coordination number than the mean. Construction of WPSLs[edit] and . is the area of the th block. References[edit]
Networks in marketing Networks are crucial parts of any action taken in a marketplace.[1] Peter Drucker [2] even described the future economy as one of a society of networks. Companies embedded in such networks stand to gain a lot.[3][4] There are a number of different network models, which have distinct relevance to customers,[4] and marketing initiatives. A network in marketing can be formed either strategically (e.g. Business networking) or completely randomly (e.g. Referral economy). “Interdependent systems of organizations and relations that are involved in carrying out all of the production and marketing activities involved in creating and delivering value in the form of products and services to intermediate and final customers.” Achrol & Kotler [3] stated that networks are not accepting of traditional mechanisms, such as authority and control. Business and marketing networks differ in the amount of connectivity between agents. Networks in general[edit] History[edit] 1960s[edit] 1970s[edit] 1980s[edit]
MIT's shapeshifting display lets you reach out and touch someone MIT has demonstrated a "Dynamic Shape Display" that can physically change shape to render 3D content. As Fast Company reports, the display is called inFORM, and it's a large surface that sits atop a series of pins, actuators, and linkages. By moving each actuator, inFORM can move the pin it's attached to up or down, allowing for a wide range of interactions. A projector mounted above the surface provides context to the shapeshifting pins, giving them color and highlighting depth. In a video released by MIT, the table is shown moving a ball, mirroring a book, displaying 3D charts, and giving an extremely visible smartphone notification. When used in conjunction with a Kinect sensor, inFORM gets a lot more interesting. MIT says it's exploring "a number of application domains" for inFORM. It's extremely impressive stuff, but it's just one step on a long path to what MIT calls Radical Atoms.
Weighted network In a number of real-world networks, not all ties in a network have the same capacity. In fact, ties are often associated with weights that differentiate them in terms of their strength, intensity, or capacity[2][3] On the one hand, Mark Granovetter (1973)[4] argued that the strength of social relationships in social networks is a function of their duration, emotional intensity, intimacy, and exchange of services. On the other, for non-social networks, weights often refer to the function performed by ties, e.g., the carbon flow (mg/m2/day) between species in food webs,[5] the number of synapses and gap junctions in neural networks,[6] or the amount of traffic flowing along connections in transportation networks.[7] Example of a weighted network (weights can also be visualized by giving edges different widths) By recording the strength of ties,[8] a weighted network can be created (also known as a valued network). Measures for weighted networks[edit] See also[edit] References[edit]